
Email ROI for retailers: linking sends to in-store return visits
You will be able to judge each retail email by the extra store visits it causes, not by opens. You match each shopper's return guest WiFi sign-in to the email before it, hold back a randomised control group and report uplift by store.
Part of the guide topicEmail marketing ROI for venues: measuring the visits it brings
Video overview
Measure retail email ROI by store visits, not opens, in nine steps on the access points you already own. Match each shopper's return WiFi sign-in to the email before it. Hold back a randomised control group and report the uplift by store. Purple Engage builds the list from GDPR-consented guest WiFi logins, so the same login records the visit.
What will your store-level email report show at the end?
Each campaign will carry one headline number: the extra store visits it caused, measured against shoppers who did not receive it. You will also have a written definition of a return visit and a fixed attribution window. The report breaks the result down by store, in a format your operations team can read.
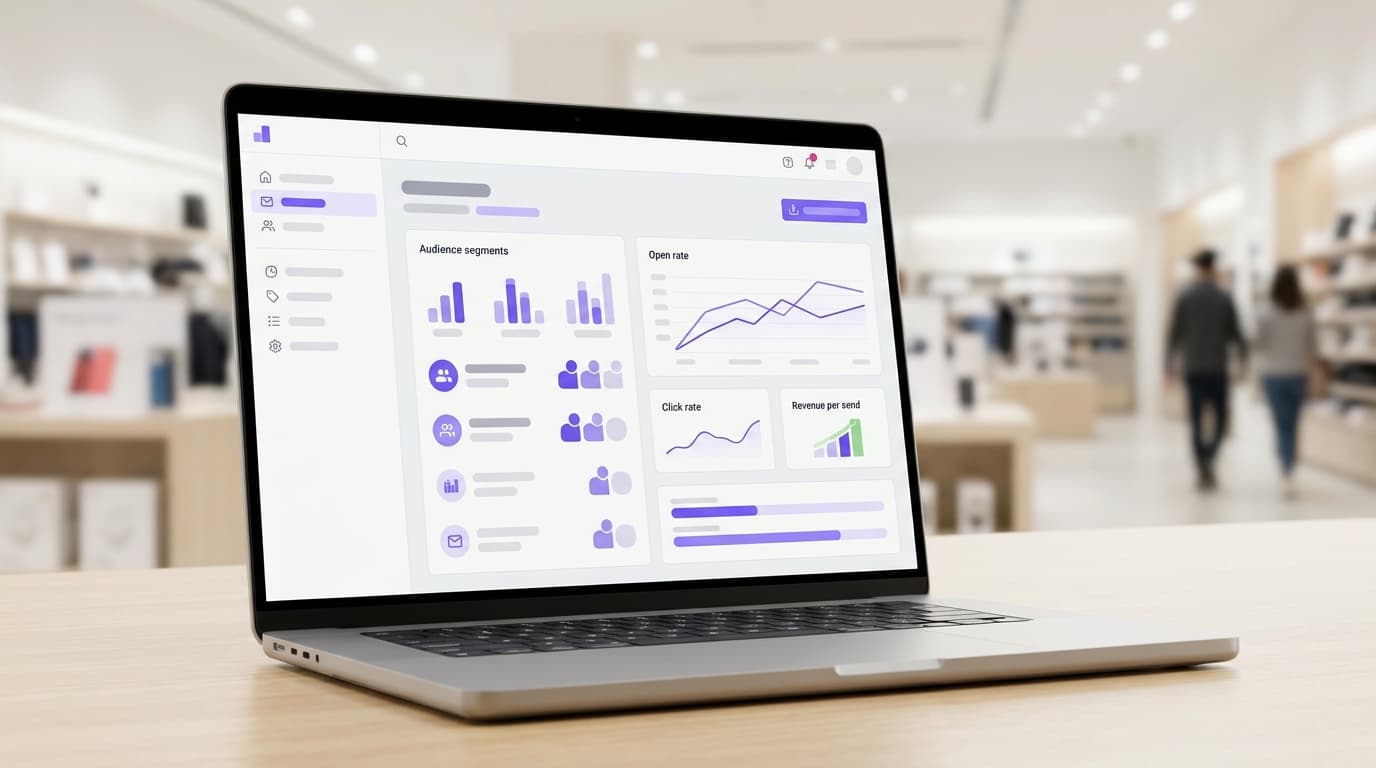
{"slot":"hero","alt":"Retail marketing manager in a store back office comparing return visits from emailed shoppers with a held-back control group, broken down by store","caption":"Judge each send by the store visits it brings, not the opens it records","prompt":"Natural light photograph in a UK fashion store back office. A marketing manager at a laptop shows a store operations director a simple bar chart comparing two groups by store. Calm, practical mood, purple accent in the interface, no readable brand logos, no readable text on screen."}
The report answers three questions for every send:
- Did it bring shoppers back?
- How many extra visits did it cause?
- Which stores carried the result?
Add average transaction value from your till system, and the same report gives you revenue per send.
This is measurement, not modelling. Nothing is estimated from industry averages. Every figure comes from your own first-party data: the guest WiFi sign-ins of shoppers who opted in to email.
What do you need before you start?
Seven things need to be in place. Most are decisions rather than technology, and they take longer to agree than to configure.
{"caption":"Prerequisites for visit-based email measurement","asOf":"2026-06-10","columns":[{"key":"p","label":"Prerequisite"},{"key":"w","label":"Why it matters"},{"key":"c","label":"How to check"}],"rows":[["Guest WiFi live on Purple at every store in the test","Return visits are only seen where shoppers sign in","Each store shows sign-ins in the last seven days"],["Branded login page with a GDPR email opt-in","Only consented contacts can be emailed and measured","A test sign-in records the opt-in on the profile"],["90 days of visit history","Sets the baseline return rate used for sizing","Reports show return visits for the full period"],["An opted-in list large enough to split","Too few shoppers hides a real uplift","Run the sizing formula in step 4"],["Stores mapped to regions","Small stores are pooled for reporting","Every store carries a region label"],["Average transaction value by store (optional)","Turns incremental visits into revenue","Finance has signed off the figure"],["A signed-off test plan","Stops the metric shifting once results arrive","Window, visit definition and holdout share written down"]],"footnote":"Decisions in the last row are made by marketing and store operations together."}
If your list is still small, build capture before measurement. Our guide to retail email capture in store covers growing the opted-in list at the till and on the login page.
How does a return visit get matched to an email?
Why opens and clicks mislead store-led retail
Opens stopped being a reliable signal when Apple introduced Mail Privacy Protection with iOS 15 in 2021. The feature preloads email images, so a message can register as opened whether or not anyone read it. Open rates now say more about your list's mix of mail apps than about your campaign.
Clicks are honest but narrow. A shopper who reads a weekend offer and walks into the store never clicks. Your email platform records nothing, yet that visit is the outcome you paid for. Clicks also skew towards your most engaged shoppers, who were likely to visit anyway.
The matching rule
The match works because the email address and the visit come from the same place. When a shopper signs in to guest WiFi, they give an email address and make a conscious-choice opt-in. Purple Engage stores that as a first-party contact. When the same shopper signs in again on a later visit, that visit is recorded against the same profile.
The rule itself is short. A return visit counts when the profile that received the email signs in at any store inside the attribution window. Each shopper counts once per window, so three visits from one shopper is one return. That keeps the measure a rate, which is what the control comparison needs.
Consent comes first. Under GDPR, consent must be freely given, specific, informed and unambiguous. An unticked email opt-in and a clear privacy notice at sign-in are the starting point. Confirm the wording with your data protection officer.
{"kind":"flow","direction":"lr","caption":"How a WiFi sign-in links an email to a return visit","alt":"Flow from a shopper's first guest WiFi sign-in, through a random split into treated and control groups, to return sign-ins and a store-level uplift report.","nodes":[{"id":"a","label":"Shopper signs in to guest WiFi","sub":"Email and GDPR opt-in captured at login","tone":"brand"},{"id":"b","label":"Profile created in Purple Engage","sub":"First-party contact with visit history","tone":"neutral"},{"id":"c","label":"Random split before send","sub":"Treated group and held-back control","tone":"neutral"},{"id":"d","label":"Email sent to treated group","sub":"Control receives nothing from this campaign","tone":"neutral"},{"id":"e","label":"Return sign-in inside window","sub":"Same profile, any store, counted once","tone":"success"},{"id":"f","label":"Uplift reported by store","sub":"Treated return rate minus control rate","tone":"brand"}],"edges":[{"from":"a","to":"b","style":"solid"},{"from":"b","to":"c","style":"solid"},{"from":"c","to":"d","label":"treated","style":"solid"},{"from":"c","to":"e","label":"control","style":"dashed"},{"from":"d","to":"e","style":"solid"},{"from":"e","to":"f","style":"solid"}]}
Why the control group matters
Matching shows that emailed shoppers came back. It does not show that the email made them come back. Your opted-in shoppers are already your most loyal, and many would return with no email at all.
The held-back control group answers the real question. It is a random slice of the same list that receives nothing from the campaign. The gap between the two groups' return rates is the visits the email caused.
How do you set up visit-based measurement, step by step?
Work through the nine steps in order. Steps one to six happen before the send. Steps seven to nine happen once the window closes.
{"title":"Measure retail email ROI by store visits","steps":[{"title":"Confirm consent at sign-in","body":"Check every store uses a branded login page with an unticked email opt-in and a privacy notice that covers visit data.","check":"A test sign-in creates a profile marked as opted in to email."},{"title":"Define a return visit","body":"Count a guest WiFi sign-in on a later day, at any store, once per shopper per window. Exclude staff devices.","check":"The definition is written into the test plan and signed off."},{"title":"Fix the attribution window","body":"Choose seven or 14 days after the send, matched to how often your shoppers normally return.","check":"The window and send date are recorded before the send."},{"title":"Size the control group","body":"Use the sizing formula below with your 90-day baseline return rate to set the holdout share.","check":"The control group meets the minimum count for the uplift you want to detect."},{"title":"Split the audience at random","body":"Randomise opted-in contacts into treated and control within each store. Keep control out of every other email in the window.","check":"Prior 90-day return rates of the two groups sit within one percentage point."},{"title":"Send to the treated group only","body":"Schedule the campaign to the treated segment and note the send time.","check":"The send log shows zero control contacts received the email."},{"title":"Export visits when the window closes","body":"Pull return visits for both groups by store, using the same definition and dates.","check":"Every visit carries a profile, a store and a timestamp inside the window."},{"title":"Calculate uplift by store","body":"Subtract the control return rate from the treated return rate, then multiply by treated shoppers for incremental visits.","check":"Store incremental visits add up to the estate total."},{"title":"Verify the method","body":"Run an A/A test: split the list, send nothing, and compare return rates over the same window length.","check":"The A/A uplift sits close to zero across the estate."}]}
How big should the held-back group be?
The size of the control group depends on two inputs. One is your baseline return rate. The other is the smallest uplift worth knowing about. A fixed percentage does not decide it. Lehr's rule gives a quick estimate for roughly 80% power at a 5% significance level:
Shoppers needed per group = 16 × p × (1 − p) ÷ d²

p = baseline return rate in the window (0.18 for 18%)
d = smallest uplift worth detecting (0.02 for two points)

Example: 16 × 0.18 × 0.82 ÷ 0.0004 = 5,904 shoppers per group
Your holdout share may deliver fewer than 5,904 shoppers. If it does, you have three options. You can raise the holdout share, accept a larger detectable uplift, or pool several sends of the same campaign.
{"tone":"tip","title":"Default holdout share","text":"Start at 10% for lists above 50,000 opted-in shoppers and 20% below that. Then run the formula to confirm the control group is large enough."}
Calculating uplift and revenue
Use the same arithmetic for every campaign so results compare like for like.
Treated return rate  = treated shoppers who returned ÷ treated shoppers
Control return rate  = control shoppers who returned ÷ control shoppers
Uplift               = treated return rate − control return rate
Incremental visits   = uplift × treated shoppers
Incremental revenue  = incremental visits × average transaction value
{"tone":"warning","title":"One stray send ruins the test","text":"Keep control shoppers out of every email in the window, including newsletters and automated flows. A single send to control shrinks the measured uplift, and you cannot repair it afterwards."}
How do you report results by store?
Report each store against its own control shoppers, not against the estate average. Randomise within each store, a method called stratified sampling, so every store holds the same holdout share.
Be honest about precision. A store with 1,000 control shoppers and an 18% baseline can only detect an uplift of about five points. Report a store on its own only when its control group reaches that size. Pool smaller stores by region. Treat every store figure as directional; the estate figure is the result.
{"caption":"Illustrative store report for one send, 14-day window","asOf":"2026-06-10","columns":[{"key":"s","label":"Store"},{"key":"n","label":"Treated / control shoppers"},{"key":"t","label":"Treated return rate"},{"key":"c","label":"Control return rate"},{"key":"u","label":"Uplift (points)"},{"key":"i","label":"Incremental visits"}],"rows":[["Store A (flagship)","9,000 / 1,000","23.0%","19.5%","3.5","315"],["Store B","5,400 / 600","20.5%","18.0%","2.5","135"],["Store C","2,700 / 300","19.0%","19.7%","-0.7","-19"],["Other 15 stores","47,700 / 5,300","20.8%","18.4%","2.4","1,145"],["Estate total","64,800 / 7,200","21.0%","18.6%","2.4","1,576"]],"footnote":"Illustrative figures. Stores B and C fall below 1,000 control shoppers, so read them as directional and pool them by region. Estate incremental visits sum the store rows; uplift is rounded.","download":{"filename":"store-email-uplift-report.csv"}}
Store C shows a negative uplift on 300 control shoppers. At that sample size, it is noise. It is not evidence that the email drove shoppers away. Pool it with its region before anyone reads anything into it.
Worked example: an 18-store fashion retailer
Illustrative figures, using the method above.
Situation. An 18-store fashion retailer had 72,000 shoppers opted in through guest WiFi over the previous 12 months. Its email reports showed opens and clicks. Store teams wanted to know whether a mid-season sale email actually brought shoppers in.
What was done. The team set a 14-day window. It took an 18% baseline return rate from 90 days of history. A 10% holdout gave 7,200 control shoppers, enough to detect an uplift of about 1.8 points. The team randomised within each store and sent the email to the other 64,800.
Outcome. Treated shoppers returned at 21.0%, against 18.6% for control. That is 2.4 points, or 1,576 incremental visits. At a £38 average transaction value, that comes to about £60,000 of incremental revenue before discount cost and margin. Only the flagship cleared the 1,000-shopper threshold for its own read. The team reported the other stores by region.
Worked example: a 12-site bar group
Illustrative figures.
Situation. A 12-site bar group wanted to know whether a Thursday email filled the weekend. It had 9,000 guests opted in through guest WiFi and a seven-day baseline return rate of 12%.
What was done. At this list size, a 10% holdout could only detect an uplift of about 4.3 points. The team raised the holdout to 20%. That gave 1,800 control guests and a detectable uplift of about 3.1 points.
Outcome. Guests who received the email returned within seven days at 16.0%, against 12.0% for control. That is four points across 7,200 guests, or 288 incremental visits. The group reported the result for the estate only. With about 150 control guests per site, no single site could support its own read.
How do you verify the result before you report it?
Run through this list before the report reaches store operations or finance.
{"title":"Verify the result before you share it","groups":[{"heading":"Before the send","items":[{"text":"Return visit definition and window signed off","why":"Stops the metric moving after results arrive"},{"text":"Treated and control prior return rates within one point","why":"Confirms the split is random"},{"text":"Control excluded from every other email in the window"},{"text":"Staff devices excluded from both groups"}]},{"heading":"After the window closes","items":[{"text":"Send log shows zero control recipients"},{"text":"Store totals reconcile to the estate total"},{"text":"Stores under 1,000 control shoppers pooled by region","why":"Small samples produce noise, not findings"},{"text":"A/A test on a no-send period shows uplift near zero","why":"Proves the method does not invent uplift"},{"text":"Revenue uses the finance-approved average transaction value"}]}],"download":{"filename":"retail-email-roi-verification.csv"}}
What the numbers cannot tell you
- Visits from shoppers who do not connect. WiFi only sees shoppers who sign in, so the method undercounts total visits. The uplift comparison still holds, because both groups are undercounted alike.
- Spend. A sign-in shows a visit, not a basket. Revenue relies on average transaction value unless you join WiFi data to till receipts.
- Online sales. A shopper who reads the email and buys on your website shows up as no visit at all.
- Why it worked. The test shows the email caused visits. It does not show whether the subject line, the offer or the image did the work. Test one change at a time if you need that answer.
- Long-term effects. A 14-day window misses a shopper who returns in week three. Hold out a group across a full quarter to estimate the effect on lifetime value.
If a step fails
- Groups differ before the send (step 5). Re-randomise the split. Never adjust the groups by hand.
- Control received the email (step 6). Discard the test and rerun it on the next send.
- A store shows no visits (step 7). Confirm guest WiFi sign-ins are live at that store before you read anything into the result.
- Uplift looks implausibly high (step 8). Check that the export counts shoppers once per window, not every visit.
For deeper diagnosis of how return visits are counted and where they go missing, see our guide on how to measure repeat visits.
Which mistakes skew retail email attribution?
- Reading opens as intent. Privacy features inflate opens, so a high open rate proves nothing about store visits.
- Choosing the window after seeing results. A window picked to flatter a campaign cannot be compared with the next one. Fix it in the test plan.
- Letting control shoppers receive other emails. Automated flows are the usual culprit. Exclude control from every flow for the window.
- Counting every visit instead of every shopper. Your most frequent shoppers then dominate the result, and the uplift stops being a rate.
- Including staff devices. Staff sign in every shift, which distorts both groups.
- Ranking stores on small samples. A league table built on 300 control shoppers rewards luck. Pool small stores by region.
- Comparing with last year instead of the control. Weather, calendar dates and product ranges all change. Only a concurrent control group isolates the email.
Where does this sit in your email ROI programme?
This guide is the retail chapter of our pillar on email marketing ROI for venues and the visits it brings. The pillar covers the full programme: capture, segmentation, measurement and reporting across hospitality, retail and events. For retail capture and segmentation, see Purple Engage for retail. For the wider case for WiFi-led marketing, read the WiFi marketing guide.
The method depends on one thing generic email platforms do not provide: a list that builds itself from in-store WiFi logins, with visits recorded against the same profile.
{"tone":"proof","title":"Purple at scale","text":"Purple runs guest WiFi at 80,000+ venues in 90 countries, handling 500 million logins a year, and branded login pages see opt-in rates around 50% higher (Purple data). Brands including Harrods and McDonald's use Purple."}
Frequently asked questions
Does visit matching work with the access points we already own?
Yes. Purple is hardware-agnostic and runs as a cloud overlay on Cisco Meraki, HPE Aruba, Ruckus, Juniper Mist, Ubiquiti UniFi, Cambium, Extreme and Fortinet. The measurement in this guide happens in Purple Engage, not on the access point. The method is therefore the same whichever vendor each store uses. If your estate mixes vendors after an acquisition, the store report treats every store alike.
How is this different from email ROI reporting in Mailchimp, Klaviyo or HubSpot?
Those platforms report what happens in the inbox and online: opens, clicks and web orders. They send to a list you bring, but they do not build it. Purple Engage builds the list from consented guest WiFi logins and records each shopper's next sign-in at a store. That lets you judge a send by the visits it brings, which is the outcome a store-led retailer reports to the board.
Is measuring return visits from WiFi sign-ins GDPR compliant?
It can be, provided consent is captured properly and your privacy notice explains how visit data is used. GDPR requires consent that is freely given, specific, informed and unambiguous. In practice, that means an unticked opt-in and plain-language wording at sign-in. Purple is ISO 27001 certified and GDPR compliant, and the login page records each shopper's choice. Confirm the wording with your data protection officer before launch.
How long before we have a reliable result?
Expect a result one attribution window after the send, plus a day to pull the data. With a 14-day window, you have a read about 15 days after the send. Reliability depends on sample size rather than time. If the sizing formula says your groups are too small, repeat the campaign over two or three sends. Then pool the results before you draw a conclusion.
Can we put a revenue figure on each send?
Yes, if finance supplies an average transaction value per store. Multiply incremental visits by that value to get incremental revenue. Subtract discount cost and send cost to get a return figure. WiFi data shows that a shopper came back, not what they bought. Joining sign-ins to till receipts gives spend per visit, but that is a separate data project. The visit-based figure stands on its own.
What about the contacts we already hold outside Purple?
You can keep emailing them, but leave them out of the measured test. Matching needs a WiFi sign-in on the same profile. A contact who has never signed in at a store cannot be matched to a return visit. Measure the WiFi-sourced list first. Then grow the measurable share through capture at the till and on the login page, as set out in our retail capture guide.
Why not measure with a printed promo code instead?
Codes measure redemptions, not visits. They miss shoppers who came back because of the email but never used the code. They also reward shoppers who would have bought anyway. A held-back control group catches both effects, because it compares return rates rather than counting coupons. Keep codes for offer mechanics and use the control group for measurement.