
Restaurant customer retention: How to measure and grow it
Learn what restaurant customer retention means, how to measure it, and how guest data and behavior-based campaigns bring diners back.
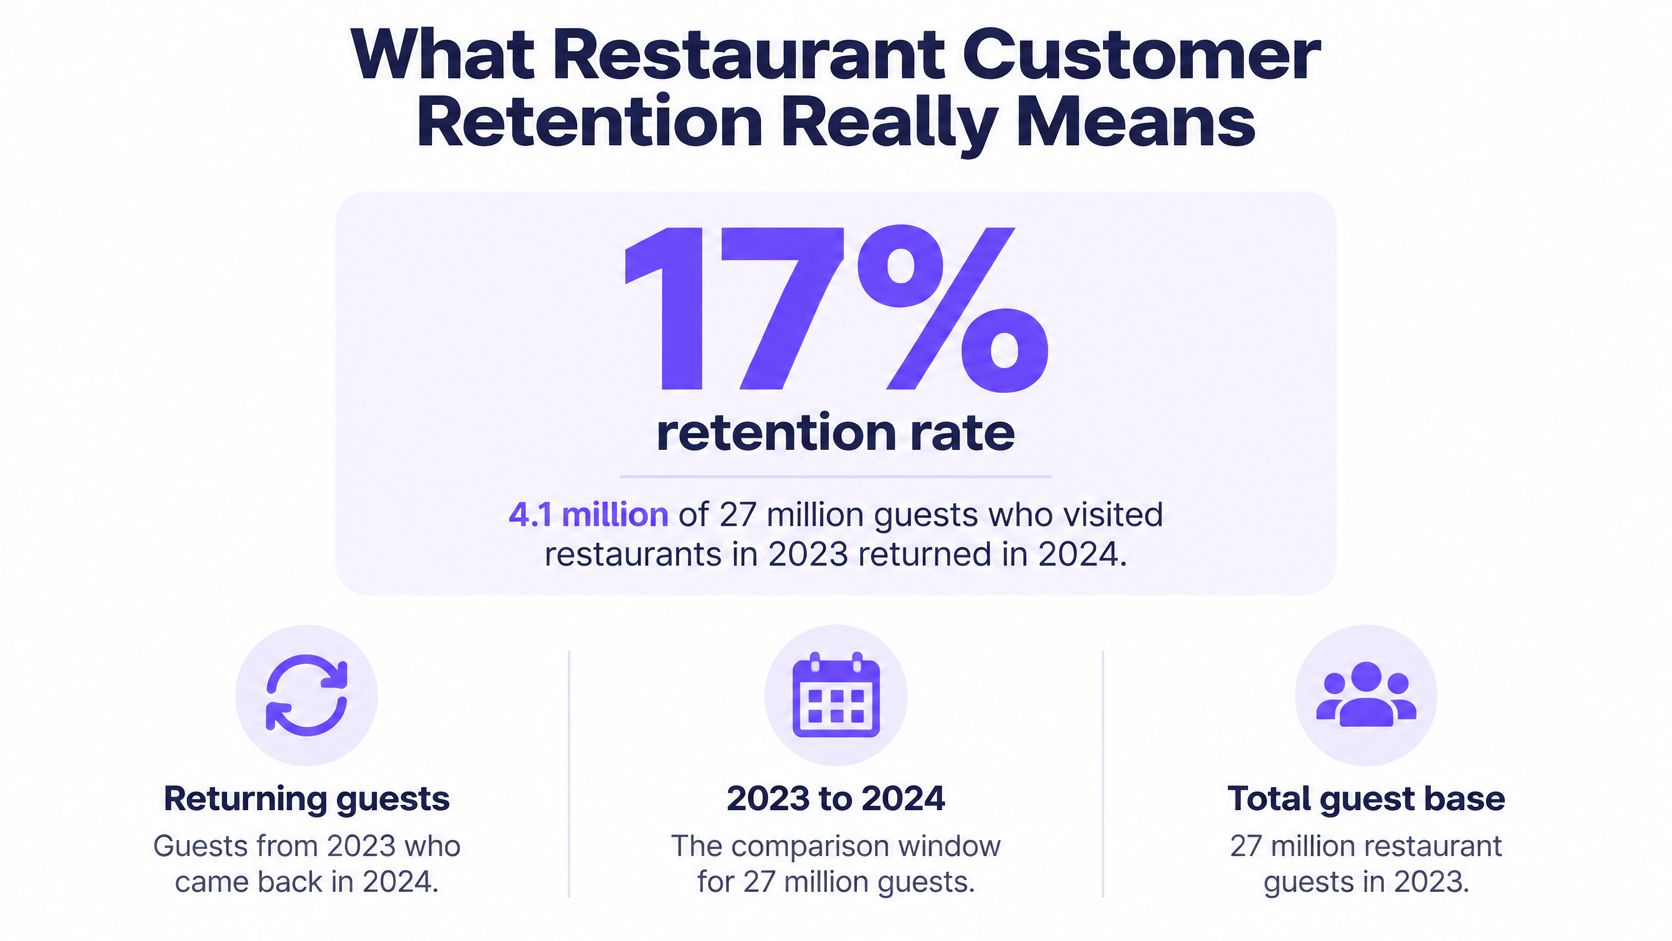
Most restaurant marketing still chases the next new diner. The harder number sits in the guests you already served. Among 27 million guests who visited restaurants in 2023, 4.1 million returned in 2024, a 17% retention rate, according to Data Delivers' 2025 restaurant guest engagement report. Busy Fridays do not cancel that gap.
If you own the sites or run the campaigns, treat guest count and retention as different jobs. One fills seats tonight. The other asks whether last year's diners came back.
Table of Contents
- What Restaurant Customer Retention Really Means
- The Retention Metrics to Track and Their Benchmarks
- How Format Shapes the Repeat-Sales Share
- How to Capture Guest Data Without Losing Trust
- Food, Service, Value and Atmosphere Drive Repeat Visits
- Behavior-Based Campaigns That Bring Lapsed Guests Back
- Set Your Retention Baseline and Test One Campaign
What restaurant customer retention really means
Restaurant customer retention is the share of guests who come back inside a window you set before you look at the numbers. It is not the size of the email file, and it is not total covers in a strong week. Say 400 people ate with you in March and 80 of them eat with you again before that window closes. Retention for that group is 20%, even if every Friday looked packed.
Acquisition fills the bucket. Retention plugs the holes. A bucket that loses most of its water each year will not stay full just because you keep pouring new guests in the top. Marketing that only buys first visits is pouring faster, not fixing the leak.
The leak hides in a full room. A small set of regulars can carry the sales while first-timers cycle through once and disappear. Staff recognise faces and assume the room is loyal. The till only shows that someone paid.
A 30-day return, a 90-day return, and a 12-month return are three different scores. Name the window on every report, or two sites in the same group will argue about numbers that do not match.
The same mix-up shows up outside restaurants. A gym that celebrates new sign-ups and ignores who renewed is making the mistake laid out in this guide to gym member retention metrics to track. Headcount feels like health. Repeat behaviour is the health check.
Build the work in a fixed order. Pick the metrics and one window, see how your format changes the sales mix, capture email without burning trust, read food, service, value and atmosphere after the visit, send a few behaviour triggers, then prove one campaign against guests you deliberately did not contact.
The retention metrics to track and their Benchmarks
Five numbers are enough to run restaurant customer retention. Each one needs a formula, a window, and a reference so a baseline means something next quarter.
| Metric | Calculation | Window | Reference value |
|---|---|---|---|
| Second-visit rate | Guests with a second visit / first-time guests | 30 or 90 days | 25% within 90 days (Bloom Intelligence, 2025) |
| Annual retention rate | Guests returning / guests at start of year | 12 months | About 21% (Bloom Intelligence, 2025) |
| Return visit rate | (Return visits / Emails sent) x 100 | 14 or 30 days | Start at 14 days; score footfall, not opens |
| Lapse rate | Guests past their normal visit gap / active guests | 30, 45 or 60 days | Set the gap from your own visit cycle |
| Customer lifetime value | Avg visit frequency x Avg spend x Avg tenure | Lifetime | $26 average for one-time visitors (Bloom Intelligence, 2025) |
Second visit and the year view
Second-visit rate is the cleanest early signal. Divide guests who make a second visit by first-time guests, inside 30 or 90 days. An analysis Bloom Intelligence published in 2025, covering locations from January 2024 through October 2025, found that only 25% of first-time visitors returned within 90 days. The same analysis found that 69% of guests never got past one-time status.
Annual retention rate uses a longer cut. Guests who return within 12 months, divided by guests at the start of the year. Bloom Intelligence reported that restaurants lost 78.8% of existing guests within a year, which implies an annual retention rate of about 21%. A second published count for a full calendar year landed in the high teens, on a different population. Compare your figure only with a number that uses the same start group and the same window. Mixing them makes a healthy site look broken, or the reverse.
Return visits, lapse and value
Return visit rate answers a campaign question, not a database question. It is (return visits / emails sent) x 100, counted inside 14 or 30 days. We start restaurants on a 14-day attribution window and lengthen it only when guests naturally visit less often than weekly. When someone comes back, the network can recognise the device and log the visit against the campaign you sent, without a QR code or a voucher code at the till.
Lapse rate is guests who have passed their normal gap, divided by active guests. Do not copy a neighbour's cutoff. If your median gap is about three weeks, 30 days is a fair flag. If people book every month and a half, test 45 days before you lock 60.
Customer lifetime value is average visit frequency times average spend times average tenure. Bloom Intelligence put average lifetime value at $26 for one-time visitors, which is the commercial gap between a single ticket and a repeat relationship. Compare opted-in guests with walk-in guests in the same cohort, or you will credit the programme for people who were already going to spend more. The working version of that comparison sits in our guide to customer lifetime value for restaurants and hotels.
Pick one window from your format, then use it on all five metrics. A 30-day lapse report next to a 90-day second-visit rate will not tell you if the programme moved.
How format Shapes the repeat-sales share
Repeat guests do not just come back more often. They account for most of the sales, and the share changes with the service model. Industry figures attributed to National Restaurant Association research, summarised by Restroworks, put repeat-guest sales at about 71% in quick-service, 68% in fast-casual, 64% in casual dining, and 51% in fine dining.
| Format | Repeat-guest share of sales | Typical visit pattern | Suggested window |
|---|---|---|---|
| Quick-service | 71% | Habitual, high-frequency | 30 days |
| Fast-casual | 68% | Habitual, high-frequency | 30 days |
| Casual dining | 64% | Mixed routine and occasion | Set from your own visit gap |
| Fine dining | 51% | Occasion-based, longer booking cycles | 90 days |
Why the same window fails both sites
Quick-service and fast-casual live on habit. People decide in minutes, often at the same time of day, and a missed week is a real lapse. A 30-day window matches that rhythm. Fine dining lives on occasions, longer booking cycles and higher checks. A couple who ate with you in March may not be "lost" in April. Judging that room on a 30-day score will make a healthy book look like churn.
Casual dining sits in the middle, part weeknight routine and part birthday table. Do not borrow the quick-service window or the fine-dining window by default. Measure the gap between visits for guests who came at least twice, then set the flag there.
Three companions to the sales share
Track three figures next to the repeat-sales share, or the percentage will flatter you.
- Visits per guest: frequency, not just whether anyone returned.
- Average order value: whether return guests spend like first-timers or trade up.
- Days between visits: the gap that should set your lapse rule.
Say a fine-dining room shows a 51% repeat share and typical gaps near 60 days. Occasion reminders, a note before a known celebration, will grow repeat visits. A daily promo will mostly discount people who were coming anyway, and it will train the list to wait for a deal.
Compare your own repeat share with the band for your format, then lock the window that fits your typical gap. A group with both a counter brand and a dining room should not force one window onto both.
How to capture guest data without Losing trust
Personalisation does not automatically bring people back. In a 2025 PAR Technology survey of 1,000 U.S. consumers, one-third said they used restaurant loyalty programmes more often because of economic pressure, and nearly 70% said those programmes help them manage costs. Feeling about prediction was split. Only 24% were excited by features such as usual-order recommendations, while 27% were worried about accuracy. 52% said real-time personalised perks would increase trust when privacy boundaries were respected.
Permission is not the same as relevance. A guest can opt in and still hate a fourth email this month, a guess about their household, or an offer that ignores what they ordered.
Five steps and the reason for each
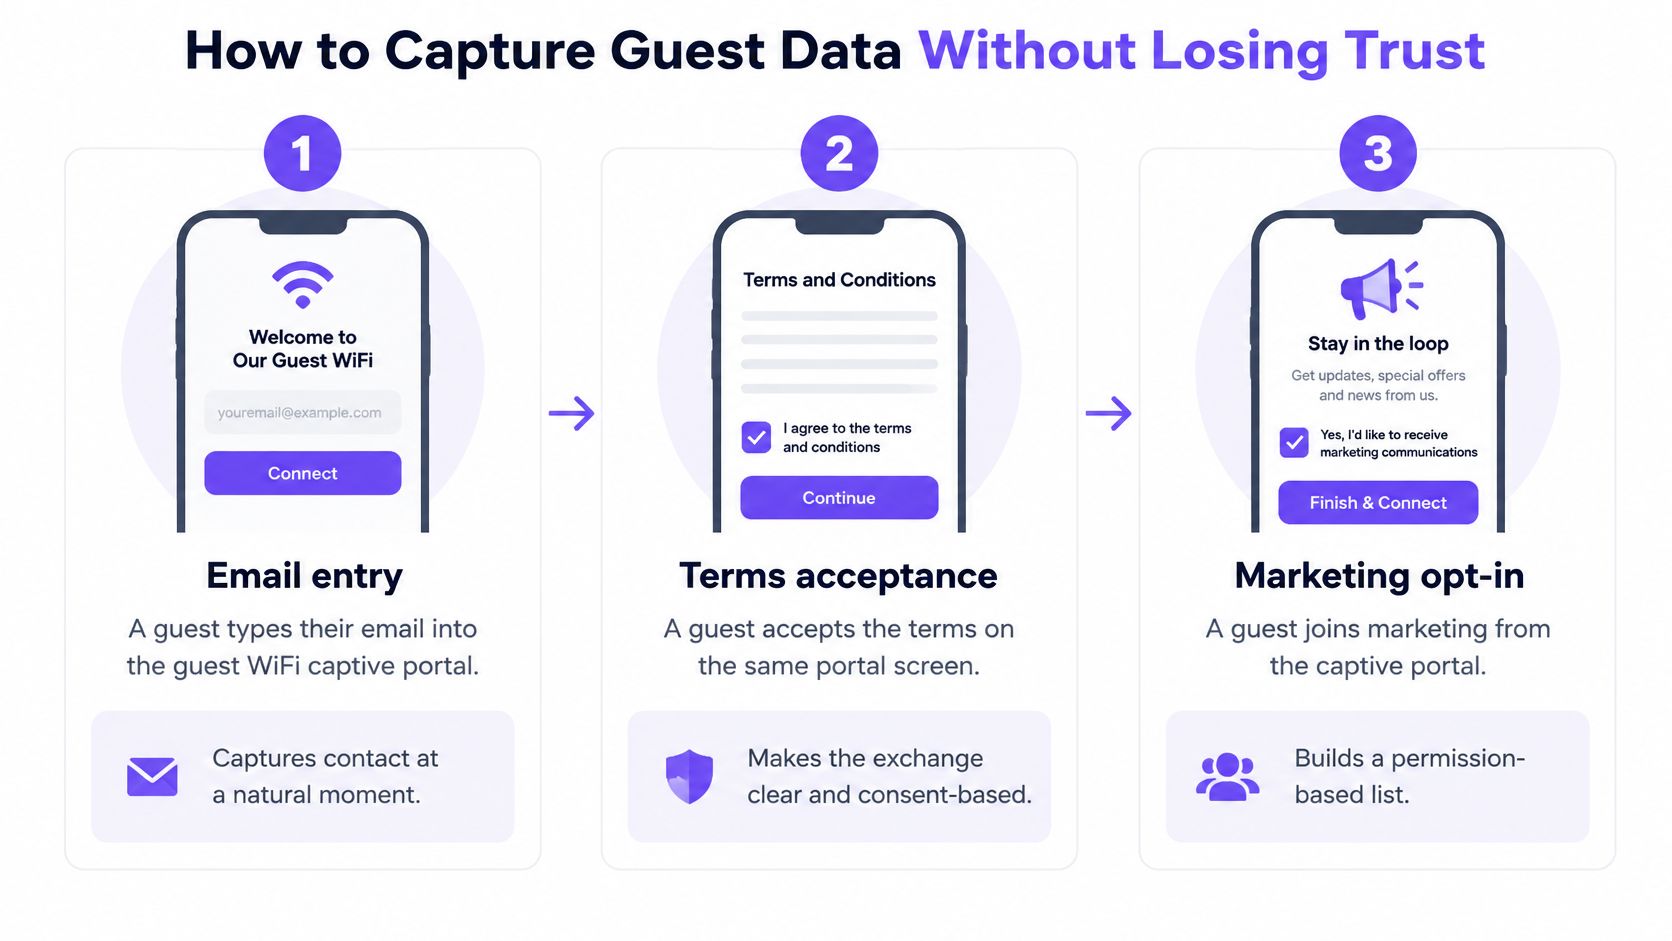
- Ask on the guest WiFi portal. The guest enters an email, accepts terms and opts in to marketing at the moment they connect. You store email, visit date, dwell time and preferred location then, not from a card they lost three weeks later. The same path, without a paper form on the table, is set out in our guide to collecting customer emails without forms.
- Match till, booking and survey records to that email. One guest should have one history. A booking under a different spelling and a till receipt under a nickname will split a regular into two strangers, and both will get the wrong message.
- Write the opt-in so it names marketing email and what those emails contain. "Join our list" is too vague. Say you will send visit follow-ups, the odd offer, and birthday notes, and nothing else.
- Store consent with a timestamp and keep opt-outs permanent. A later file import must not switch a "no" back to a "yes". That is how lists get dirty and complaints start.
- Suppress guests who just converted on an acquisition offer. They already came back for that deal. Another code the same week teaches them to wait, and it spends margin you did not need to spend.
Venues without guest WiFi can run the same five steps at the till, on the booking form and at reservation, with the same wording and the same timestamps.
Practical rule: A healthy record is one email, a visit history, spend, and a consent status you can show a manager in one line.
The common slip is importing a purchased list. Those people never agreed to hear from your restaurant. Delivery rates fall, and the guests who did opt in get caught in the damage. After offer cost and unsubscribes, a message only counts if it produces profitable repeat visits.
Food, service, value and atmosphere Drive repeat visits
A message cannot repair a meal people did not enjoy. In a quantitative study of 410 restaurant customers, food quality, service quality and atmosphere significantly predicted revisit intention, with a standardised regression coefficient of β = .703. The model explained 49.4% of the variance in revisit intention (R² = .494, p < .001), according to the Gading Journal study. Customer satisfaction carried much of that effect. The experience sets an overall verdict, and the verdict sets whether they book again.
A separate analysis of 10,136 online restaurant reviews found that food quality, price and value, service quality and atmosphere are significant antecedents of intention to revisit, as reported in that review study. Discounting is not a substitute for those four.
A score you can act on
After each visit, ask for a 1 to 5 score on food, service, value and atmosphere. Keep it short enough that a Tuesday lunch guest will finish it.
Say a diner scores food 5 and service 2 on a Friday lunch. A 20% code wastes money and leaves the problem in place. A manager follow-up, plus a service-recovery note that names the slow handoff rather than "we hope you enjoyed everything", matches the cause. If value is the low score, look at menu pricing and portion consistency before you blanket the list with discounts. A low food score points at kitchen consistency on that dish, not at the email subject line.
Families planning a special outing already think hard about timing and atmosphere. A capybara cafe timing guide for families is a reminder that the room, the wait and the hour change whether people want to repeat the trip. Your scores should catch that before a campaign tries to paper over it.
What to check this month
- Lowest driver: which of the four scores is weakest across the last 30 visits.
- Who feels it: which daypart, site or server group shows that low score.
- Floor change: one operational fix, not a new offer, tied to that score.
Segment by satisfaction and recency. Detractors get a recovery message from a manager. Satisfied guests get a reminder only as they near their own lapse window. A flat "no visit in 45 days" rule should follow your visit-cycle distribution, not a number copied from another brand.
Behavior-Based campaigns that bring lapsed guests back
Build triggers in the order a guest moves, and judge each one by people walking back in. Opens and clicks can look healthy while the dining room does not change. A high open rate with no return visits brought nobody back.
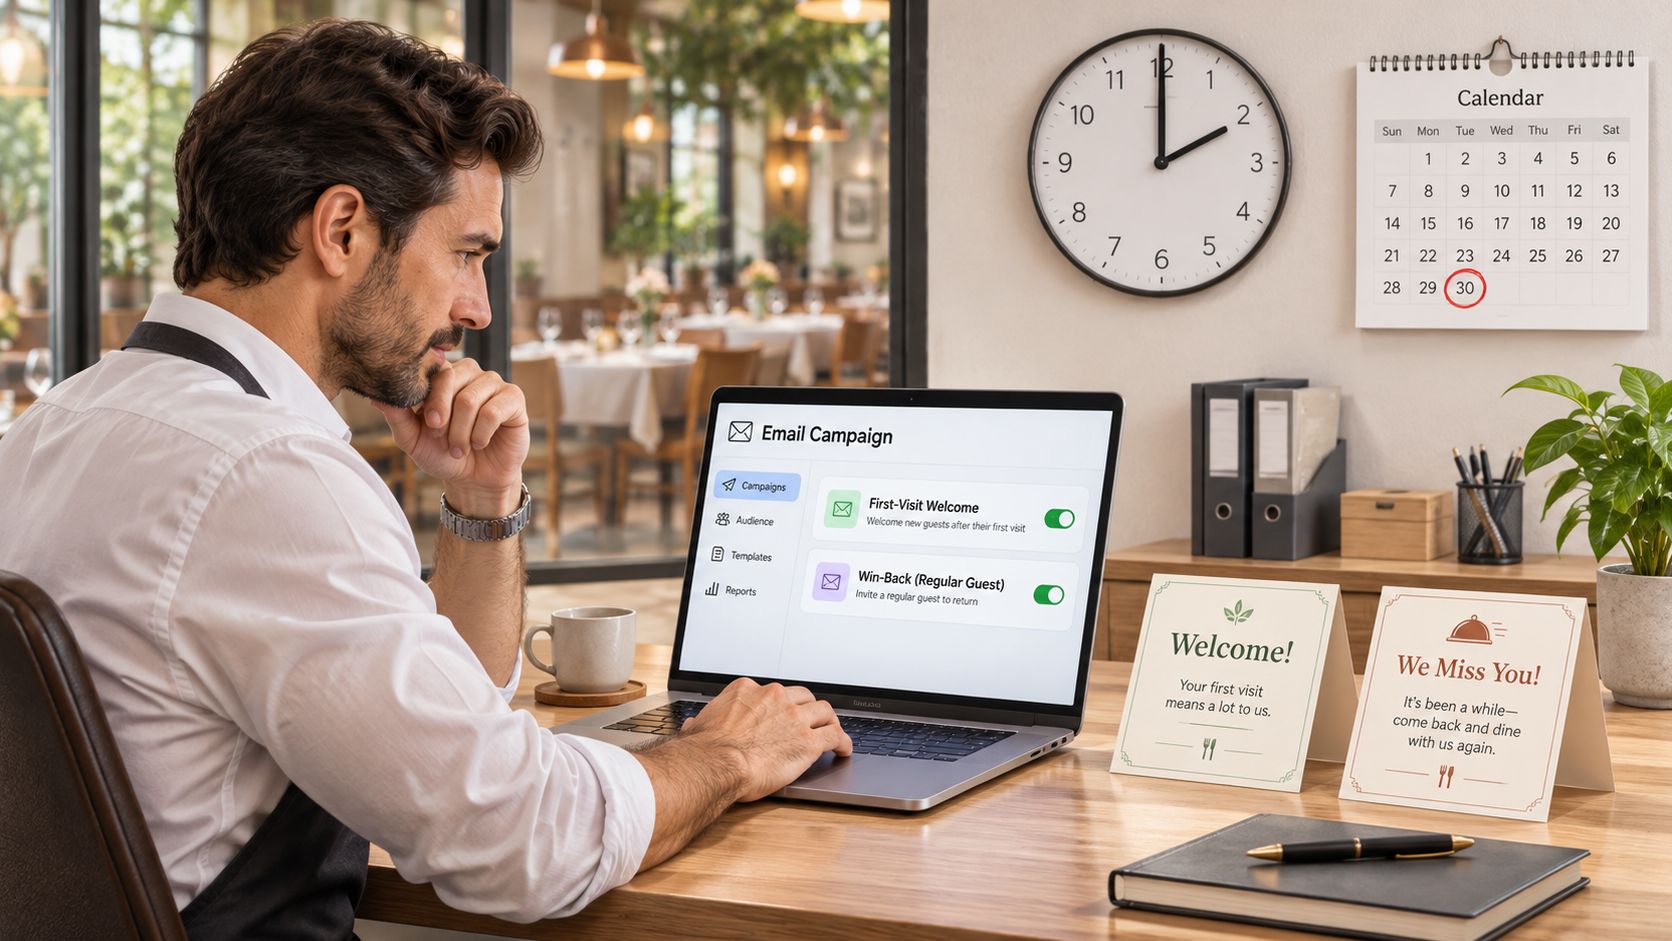
Build order
Welcome, two hours after a first-timer leaves. The visit is still fresh. Thank them, name one dish they are likely to remember, and give a single reason to return. Do not attach a deep discount to a first impression that was already good.
"We miss you" at 30 days for a regular. This is the right first lapse trigger. We treat 30 days as the starting point, then test the same note at 45 days and compare return visit rate before anyone freezes the cutoff. A guest who visited three times last month and then went quiet needs a different note from someone who came once.
Lapsed offer at 60 days, only if the 30-day note did not bring them back. Send it on day 60 to regulars with no visit. Skip anyone the earlier message already converted. Stacking codes trains the list to ignore you until the offer gets bigger.
Birthday offer, two weeks before the date. Occasion demand is real in casual and fine dining. Two weeks gives a booking cycle room. A code that lands on the morning of the birthday often misses the reservation.
The pattern for lapsed guests, including what to say when the gap is long, is spelled out in our guide to win-back emails for lapsed hotel and restaurant guests.
Keep the list willing
Match the copy to visit history. Three recent visits and a 30-day gap is "we kept your usual table in mind". One visit six months ago is not the same relationship, and it should not get the regular's tone.
Keep offers small. Cap how many messages and how many offers any guest gets in a month. Consent erodes when every email is a code, even if the opt-in is still on file.
Count return visits for each trigger inside your attribution window. Hold a similar slice of the lapsed list back so you can see incremental returns, not just people who would have come anyway. The next section is the first-month version of that test. Change one timing, 30 days versus 45, and keep everything else still.
Set your retention baseline and test one campaign
A pile of discounts is not a retention programme. A programme is a baseline, one trigger, and a group you deliberately do not contact.
The first month
- Pull the last 90 days of visits. Calculate second-visit rate and lapse rate with the definitions you already chose. Write both down before anyone sends a campaign. That pair is the baseline you will defend in the next meeting.
- Choose one trigger. A "We miss you" email at 30 days is the simplest first build. Leave welcome, birthday and 60-day offers off until this one has a result.
- Split lapsed guests into a sent group and a held-out group of similar size and profile. Same sites, same recency, same rough spend. If the held-out group is all weekday guests and the sent group is all weekend guests, the test is already biased.
- Count return visits for both groups at 14 days and at 30 days. Use the same attribution window you set for return visit rate. Do not switch to opens halfway through because the footfall looks modest.
- Compare the groups. Report incremental visits, the extra returns in the sent group beyond the held-out group, and state a range. A gap of one or two visits on a small list can be noise. We measure this way so a campaign has to beat guests who received nothing.
Run the test for at least one full visit cycle. If your typical gap is about a month, four weeks is the minimum, not a weekend snapshot. Change one variable at a time. The useful first change is 30 days of absence versus 45, with the same creative and the same offer. Scale the timing that shows the clearest incremental lift, and pause the other.
Compare opted-in guests and walk-in guests inside the same segments when you look at lifetime value. Otherwise you will credit the emails for a difference that was really "people willing to share an email already visit more". WiFi sign-in, till and booking data can feed that comparison, with or without a single network vendor, as long as the held-out group stays unsent.
If the sent group does not beat the held-out group, do not add a bigger discount. Check the scores on food, service, value and atmosphere for that segment first. A recovery problem will not yield to a louder subject line.
Purple Engage turns WiFi sign-ins, till sales and bookings into one guest record, then shows which campaigns produce incremental return visits against a held-back group. If you want restaurant customer retention measured by footfall rather than opens, start with a 30-day "We miss you" test and a clean consent list. Visit Purple Engage to see how the holdout measurement works for your sites.