
What is marketing ROI? Formula and venue Examples
What is marketing ROI? Learn the formula, why incremental results matter, and how to measure it with holdout groups for venue campaigns.

Marketing ROI measures the financial return a campaign produces relative to its cost: (incremental profit minus campaign cost) ÷ campaign cost × 100. A campaign that generates $150,000 in incremental gross profit from a $50,000 investment returns a 200% ROI, or $2 for every $1 invested.
But a positive ROI doesn't prove the campaign caused the sales. A regular guest might book whether or not they saw your email, so counting every purchase after a campaign can make its impact look larger than it was. For venue businesses, sound measurement means checking what changed, including the full cost of the campaign and the uncertainty in the result.
Table of Contents
- Marketing ROI Formula With Worked Examples
- Why Incremental Revenue Counts More Than Attribution
- Costs and Time Horizon to Include in ROI
- Venue Campaign Examples and Metrics Compared
- Run a Holdout Test and Calculate Incremental ROI
- Reading Confidence Ranges Before You Decide
Marketing ROI Formula With Worked Examples
Marketing ROI (%) = (incremental revenue or profit − marketing cost) ÷ marketing cost × 100
Use incremental value, not just the sales recorded after a campaign. The useful question is how much more revenue or profit occurred because of the marketing than would have occurred without it. The UCLA Anderson MROI framework also emphasizes defining what counts as marketing value, since revenue, contribution margin and profit answer different questions.
In the worked example, a campaign produces $150,000 in incremental gross profit and costs $50,000. Subtract the cost from the profit, divide the result by the cost, then multiply by 100: ($150,000 − $50,000) ÷ $50,000 × 100 = 200% ROI. That's $2 returned for each $1 invested, after accounting for the investment.
| Incremental profit | Marketing cost | ROI | How to read it |
|---|---|---|---|
| $150,000 | $50,000 | 200% | $2 returned per $1 invested |
| $50,000 | $50,000 | 0% | Campaign only paid back its cost |
| $30,000 | $50,000 | -40% | Campaign destroyed value under these assumptions |
A 0% ROI means the measured profit matched the campaign cost. A negative result means profit fell short of the cost under the measurement assumptions. Before using either result to make a budget decision, check that the calculation uses the same definition of value and cost throughout.
Open rate, click-through rate, reach and cost per click show intermediate activity. They can help explain how a campaign performed, but they don't show whether it created profitable visits or purchases. For ideas on improving the economics of a paid campaign, see this guide to improve paid campaign profitability.
State the time horizon, cost base and whether the value means revenue, gross profit or contribution. Make clear whether the figure covers one campaign or a broader marketing program. Without those details, readers can't reliably compare results or check the arithmetic.
Why Incremental Revenue Counts More Than Attribution
A regular guest books a table every Friday. After receiving a Birthday Month email, they book again. An attribution report may credit that booking to the email, even if the guest would have visited regardless. That credit can make the campaign's ROI look higher than the return it created.
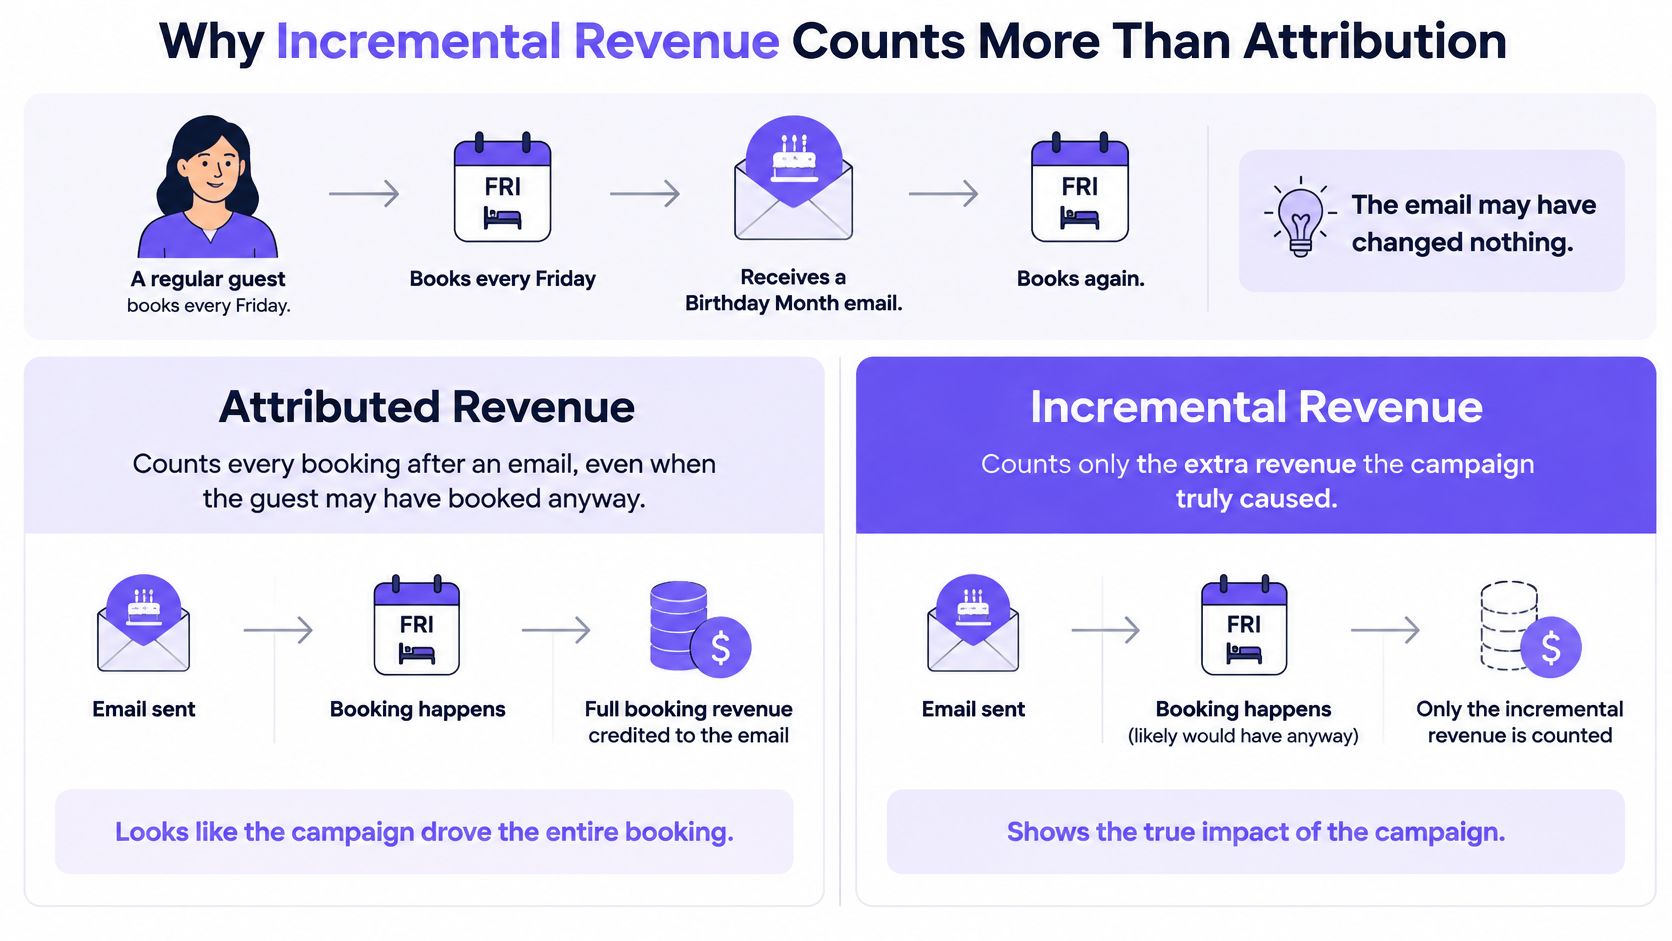
Attributed revenue assigns a purchase to a campaign after an exposure or click. Incremental revenue counts the additional purchases that occurred compared with a similar group that did not receive the campaign. The difference is like the gap between spotting a customer on the way to a venue and showing that the campaign changed their decision to go.
A positive reported ROI does not, by itself, prove that marketing caused the sale. A customer might see an ad, receive an email or redeem an offer without changing their plans. Last-click and platform reports can credit those interactions even when a visit was already likely. For a venue-specific approach, see how to attribute return visits to email campaigns.
Measuring ROI can be difficult because customer decisions have multiple influences. Regular guests may have visited anyway, and weather, local events or seasonal demand can shift traffic regardless of a campaign. Discount redemptions also need careful interpretation: they can accompany a sale while reducing the margin earned on that visit.
The useful question is “What extra behavior did the marketing create?” A comparison with a group that did not receive the campaign helps answer it more reliably than attribution alone.
Costs and Time Horizon to Include in ROI
A restaurant campaign that generates $1,000 in sales has not necessarily earned $1,000 in profit. The offer may reduce margins, and the campaign also takes time and resources to create and run. Count the costs tied to the campaign:
- Media and production: Ad spend, creative production, photography, design and agency fees.
- Technology and messages: Platform costs and per-message charges for channels such as SMS and WhatsApp.
- Offers and fulfillment: Discounts, margin lost on redeemed offers, and the cost of delivering what the campaign promised.
- People and operations: Staff time for setup and in-venue delivery, plus data operations and compliance work.
Next, set the measurement period to match the question. For near-term profitability, compare the contribution margin from campaign-driven bookings with the full cost of the offer and delivery. If you report gross revenue instead, label it clearly; revenue is not profit.
For a campaign-window estimate, compare results over the same fixed period. A hotel may see few immediate bookings from an email but additional reservations later in the measurement window. Use the same window for the campaign and comparison groups so the difference is meaningful.
Longer-term ROI should include repeat activity within a defined period. A café's first-week results may look weak even if returning guests spend more over time. A customer lifetime value approach for restaurants and hotels can help frame that question, provided the reporting period is explicit.
State whether revenue is gross or net of discounts. Apply the same definitions to email, SMS, ads and in-venue journeys; otherwise, channel comparisons may reflect different accounting choices rather than different performance.
Venue Campaign Examples and Metrics Compared

Consider a “We miss you” offer for guests who haven't visited in 30 days. A lift in return visits is useful only if it exceeds the rate among comparable guests who didn't receive the offer. The holdout helps answer whether the lapsed guests returned because of the campaign or would have come back on their own.
A Birthday Month offer can prompt a visit, but some recipients may already have planned to celebrate at the venue. Compare visit rates for the recipients and holdout, then count the difference rather than every birthday-month booking. For a lapsed-diner campaign, compare booking rates between groups to estimate how many extra reservations the campaign created.
| Metric | How it is calculated | Use it for |
|---|---|---|
| Incremental visits | Visit rate of treated guests minus holdout visit rate, multiplied by treated guests | Judging footfall from win-back or lapsed-guest journeys |
| Incremental bookings | Booking rate difference, scaled to recipients | Restaurants, hotels and venues that take reservations |
| Incremental purchases | Purchase rate difference multiplied by average spend | Retail and in-store offers |
| Contribution profit per recipient | Incremental contribution profit divided by people reached | Comparing campaigns with different costs and discounts |
These measures connect campaign activity to behavior and financial value. Open and click metrics can still help diagnose delivery or creative issues, but they shouldn't replace the outcomes in the table. For teams bringing results from several channels together, this guide to cross-channel ad performance measurement offers another way to think about consistent comparison.
Audience quality also affects the return a campaign can produce. Nielsen reported that nearly 40% of digital advertising budgets were wasted on the wrong audiences; lower-performing ad partners generated an average ROI of $0.25 per $1 spent, compared with $2.60 per $1 spent for partners reaching more of the intended audience, according to Nielsen's Annual Marketing Report. A campaign's creative and offer matter, but so does reaching people who are likely to respond.
The video below adds context on measuring campaign results across venue marketing.
Run a Holdout Test and Calculate Incremental ROI
A holdout test compares outcomes for people who receive a campaign with outcomes for a comparable group who don't. Randomized treatment and holdout groups, including user-level or geographic holdouts, help estimate the campaign's causal lift; unlike observational attribution, they don't rely on a click or exposure alone to establish impact. The experimental measurement research on holdout methods describes these approaches and why they can produce smaller, more reliable estimates than observational models.
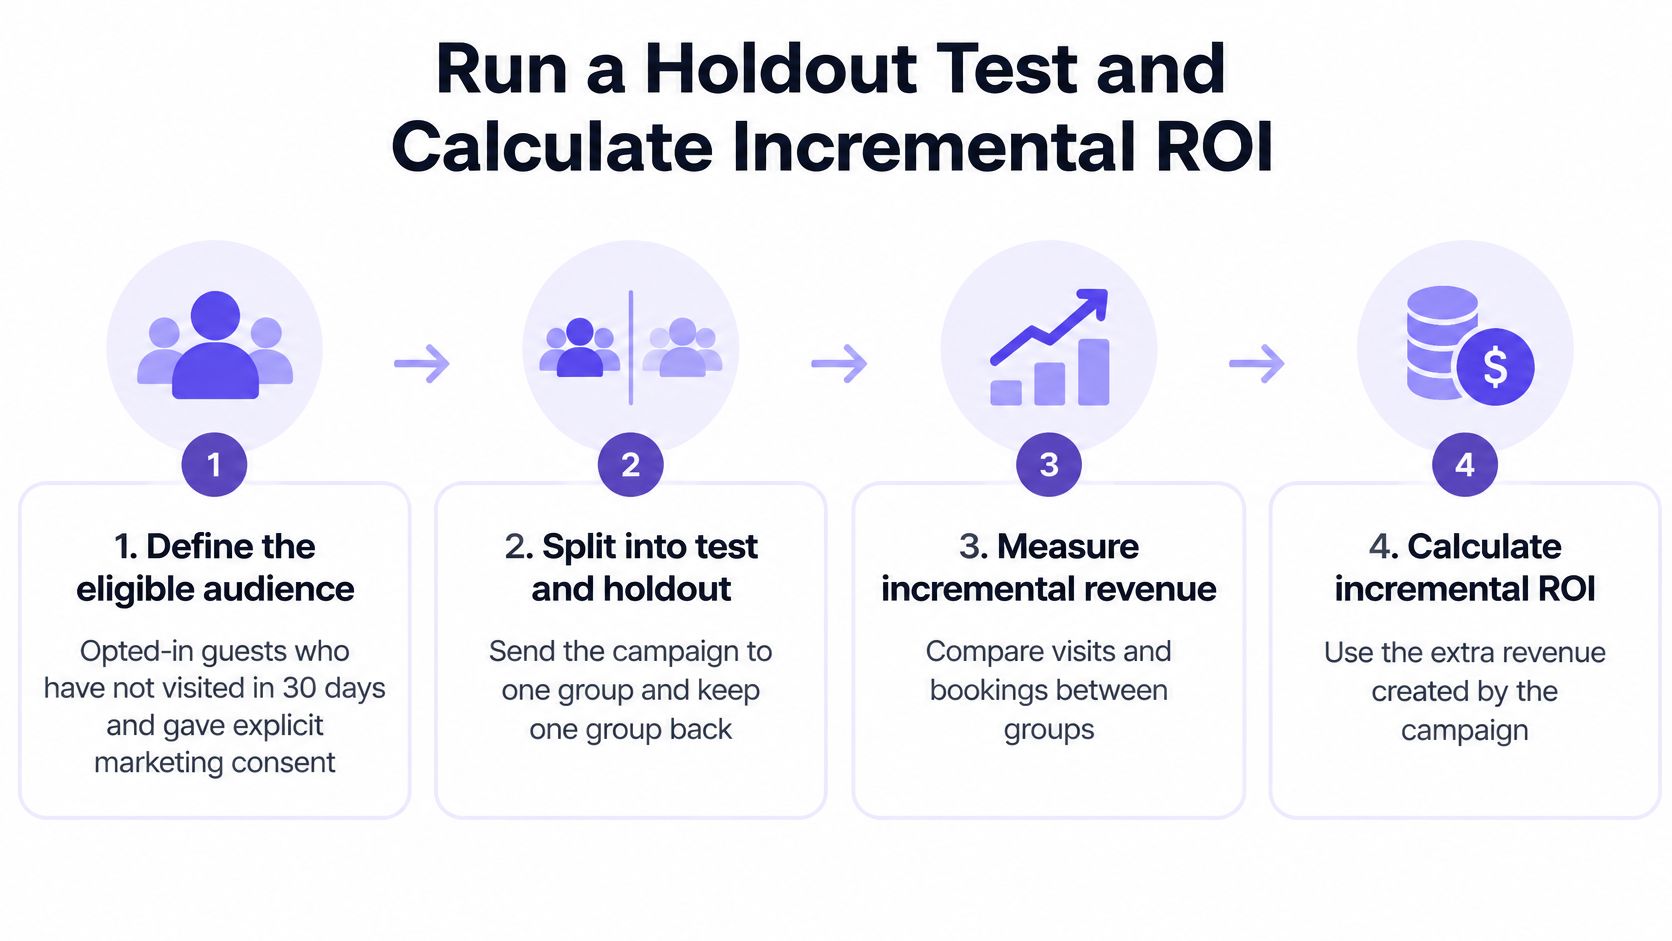
Define who is eligible. Start with opted-in guests who haven't visited in 30 days and have explicitly consented to marketing. These guests could plausibly respond to a win-back message; including people who can't receive marketing or don't fit the campaign makes the comparison harder to interpret. Purple Engage recommends starting with a “We miss you” campaign for guests who haven't visited in 30 days, then measuring the return-visit rate as a benchmark. For hotel teams adapting the approach, see this guide to digital marketing for hotels.
Randomly split eligible guests. Send the “We miss you” offer to the treatment group and keep the holdout group out of the campaign. Random assignment helps prevent one group from having more loyal guests or stronger visit intent before the campaign begins. Keep the holdout large enough to produce a result; if the group is too small, the difference may be inconclusive.
Set the measurement windows before launch. Decide which outcomes you'll count and when. For example, measure visits and bookings over 14 days and sales over 30 days, using the same windows for both groups. Don't move the end date after viewing the results, since that makes the comparison vulnerable to cherry-picking.
Compare outcome rates. If treated guests have an 8.0% purchase incidence and the holdout has 6.5%, the estimated lift is 1.5 percentage points, before accounting for sampling uncertainty. Count the purchases, bookings or visits in each group, then compare their rates. Keep other offers out of the holdout where possible; exposure to another campaign can shrink the difference.
To turn that lift into a financial result, multiply it by the treatment group size to estimate additional purchases, then value those purchases using profit rather than automatically using sales revenue. In a hypothetical example, 10,000 treated guests at a 1.5-point lift produce 150 incremental purchases. At $60 gross profit per purchase, that's $9,000 in incremental profit. With a $5,000 full campaign cost, incremental ROI is ($9,000 − $5,000) ÷ $5,000 × 100 = 80%.
Purple Engage compares campaign recipients with a deliberately held-back control group and reports a 95% range or “not measured yet.” It needs at least 50 held-back guests before reporting a campaign result; below that minimum, the card says “not measured yet.” Report the treatment population, margin assumptions and exclusions alongside the ROI so a reader can see what the estimate covers.
Reading Confidence Ranges Before You Decide
A lift estimate is an average, not a guarantee. A 95% range shows the plausible values for the true effect based on the test data. A narrow range gives a clearer basis for a decision; a wide range signals that the estimate still leaves room for very different outcomes.
| Confidence range result | What it means | Decision |
|---|---|---|
| Entirely above zero | The gain is probably real | Scale the campaign and recheck monthly |
| Spans zero | Impact is not proven | Extend the window or enlarge the groups |
| Entirely below zero | The campaign probably lost money | Pause, fix the offer, then retest |
For example, a hypothetical 1.5-percentage-point lift with a range from 0.2 to 2.8 points stays above zero. That supports scaling cautiously and checking whether the result holds in later campaigns. If the same average lift has a range from -0.4 to 3.4 points, the true effect could be negative, so it isn't decision-grade yet.
Report ROI as a range too, not just a single headline percentage. Include the treatment population, margin assumptions and exclusions; otherwise readers may mistake a precise-looking number for a certain result. A small holdout can leave the campaign without a reportable outcome. When a measurement card says “not measured yet,” that's more useful than presenting an unsupported guess as a finding.
Use the lower bound of the range, the most cautious plausible outcome, to guide the decision. If that outcome still clears your required return, scaling is easier to justify. If it doesn't, collect more evidence or adjust the campaign before committing more budget.
Purple Engage connects guest records across WiFi sign-ins, point-of-sale receipts, bookings and hotel stays, then measures campaign outcomes against a held-back control group. If you want to compare marketing activity with incremental visits, bookings or purchases, visit Purple Engage to explore how its venue marketing platform works.