
What is POS data? What it contains and how venues use it
What is POS data? Learn what a point-of-sale record contains, how venues use it to track purchases and guest behavior, and where privacy limits apply.
POS data is the structured record a point-of-sale system creates each time a sale is completed, capturing what was bought, how much was paid, when, and where. Every card tap, cash drop and split bill in your venue writes one of those records, whether or not anyone ever reads it again.
The Saturday close is where most operators meet it. The doors are locked, the tills are cashed up, and a long paper receipt curls out of the printer with a single number on it: today's takings. That number is the one everyone checks, and it's the least interesting thing the till knows.
Behind it sits a line-by-line account of the day. Two flat whites at 09:14, one of them attached to a loyalty card. A table of six splitting a bill three ways at 21:40. A refund at 15:02 because the kitchen sent the wrong dish. Each of those is a guest event, and read across a month they answer questions no survey can: which hours carry the margin, which regulars have stopped coming in, and whether last month's lunch offer paid for itself.
There's a limit worth stating early. A receipt proves a transaction happened. It doesn't prove who bought it, what they thought of it, or that they'll be back. Knowing where that line falls is what separates a useful dashboard from a stack of well-formatted guesswork.
Table of Contents
- POS Data in Plain Terms
- The Fields Inside Every POS Record
- How a Single Sale Becomes Data
- Purchase Metrics Venues Calculate From Till Data
- Common Misreadings and Privacy Limits
- Tracking Guest Behaviour Across Visits
- Measuring Promotion Impact Without Guesswork
- Decide Which Till Data to Connect First
POS data in Plain terms
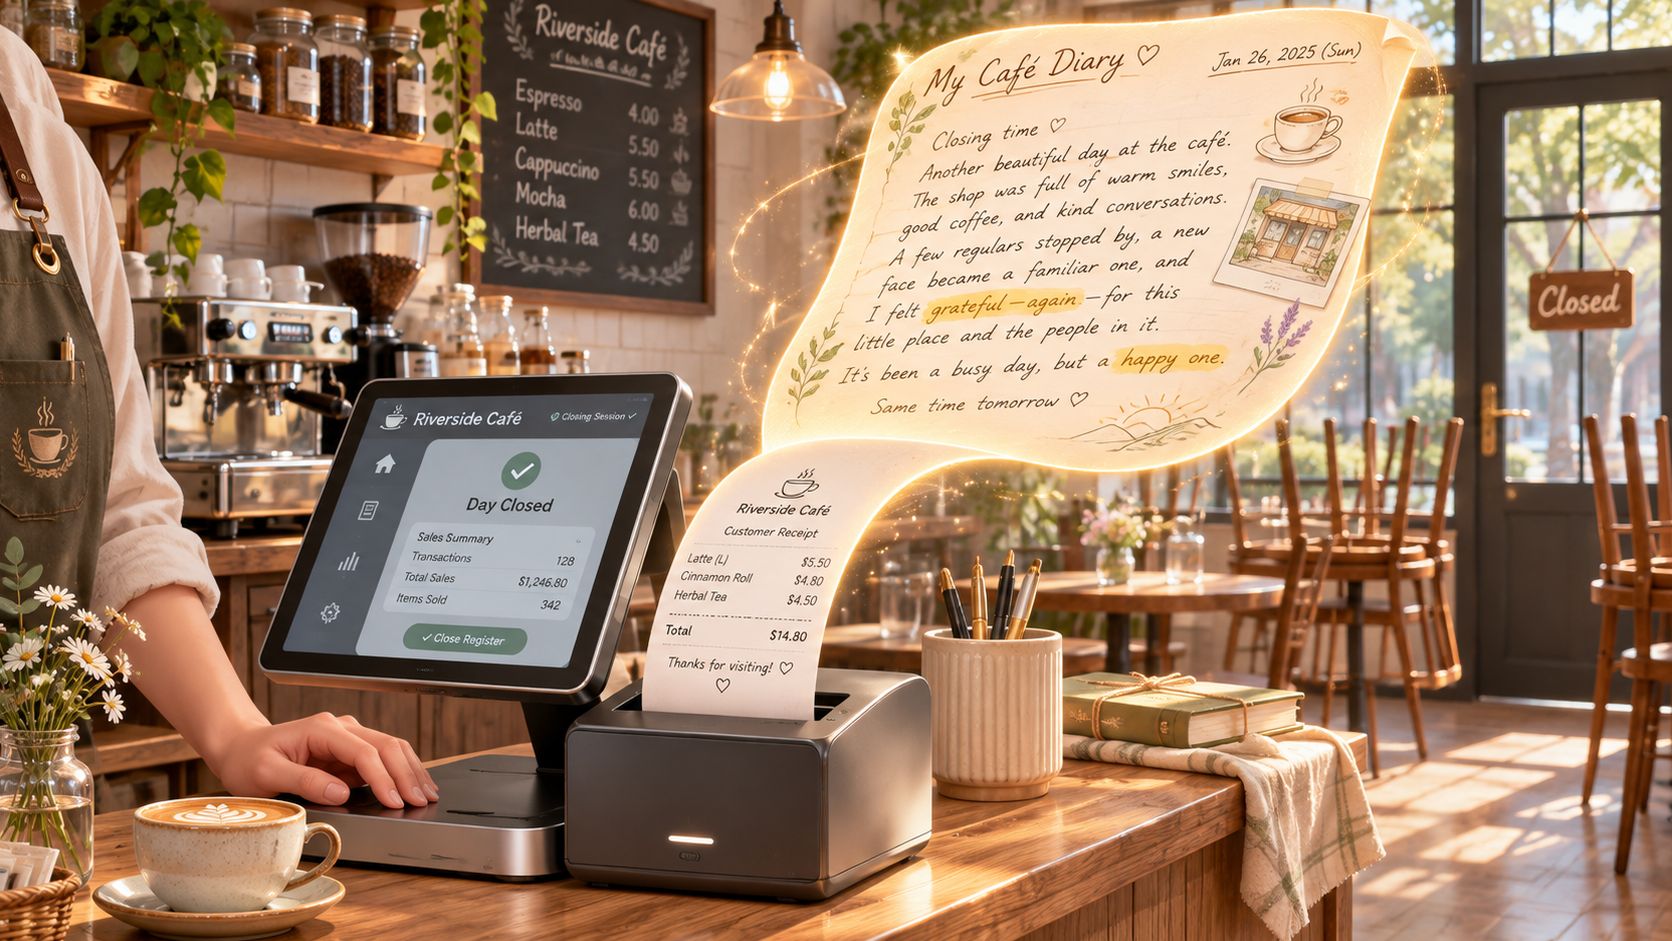
A café closes after a busy Saturday. The till's total shows how much it took, while its transaction records show the pattern behind that figure: which items sold together, when they sold, and whether a promotion was used. Each receipt is one guest event, though it may not identify the guest.
A till records what someone bought, not what they said they might buy. A customer might tell a survey they prefer single-origin coffee, then order house filter each Tuesday. The transaction captures the purchase; the survey captures the stated preference. Together, those sources can offer a fuller view, but neither should be mistaken for the other.
That distinction helps with everyday decisions. A café can compare sales by day and hour when planning staff. A bar can review which dishes sell together. A hotel can examine till sales alongside other operational records, if those sources are connected.
Operators also report a business case for technology: in 2024, 76% of restaurant operators said technology gave their business a competitive edge, according to the U.S. National Restaurant Association's technology landscape report. For a small operation setting up terminals and peripherals before turning to analytics, smart vendor POS basics covers POS hardware and daily routines.
A receipt is evidence of a transaction, not proof of who made it. A purchase becomes attributable to a person only when the till record is linked to an identifier, such as a loyalty account or booking reference. That link can make the purchase useful for guest engagement; the receipt alone cannot reveal the buyer's identity, opinion or likelihood of returning.
The fields Inside every POS record
Systems differ in how many fields they hold, but almost all of them keep a core set that maps to what you'd see printed on a receipt, read in the order a reader meets them.
| Field | What It Holds | Example | Analysis It Supports |
|---|---|---|---|
| Transaction ID | Unique reference for the completed sale | TXN-088431 | De-duplication and reconciliation |
| Date and time | When the sale was completed | Sat 14 Sep, 09:14 | Visit timing and daypart trends |
| Venue or terminal ID | Which site and till made the sale | Terminal 2, harbour site | Site-by-site comparison |
| Line item and product code | Item sold, internal SKU or GTIN | Flat white, SKU FW-01 | Product mix and menu performance |
| Quantity | Units of each item sold | 2 | Units per transaction |
| Unit price and net amount | Price paid after discounts | 2 for £6.50 | Average spend and pricing |
| Discount or promotion | Offer or discount applied | 10 percent off lunch | Offer redemption and margin cost |
| Tax | Tax charged on the sale | £1.08 at 20 percent | Net revenue calculations |
| Tender type | Payment method used | Contactless card | Payment mix |
| Refund or void | Reversal of an earlier sale | £4.20 refunded | Corrected revenue and refund rate |
| Staff identifier | Employee or server ID | Server 14 | Service analysis, handled with care |
| Customer key | Email, loyalty ID or booking reference, only if captured | Loyalty ID 88213 | Linking purchases to a guest record with consent |
Start with the transaction ID, because it's the field that keeps the rest honest. A system that issues duplicates after a network retry will double-count revenue, visits and offer redemptions in one movement, and the ID is how you catch it.
Date, time and venue turn a pile of receipts into a rhythm: the 08:00 to 10:00 coffee rush, the Friday bar spike, the Sunday lunch that carries a third of the week's revenue at one site. The line item code is where discipline pays off. For retail interoperability, GS1 specifies the Global Trade Item Number as the primary identifier for trade items in formats such as GTIN-8, GTIN-12 and GTIN-13, carried in EAN/UPC or GS1 DataBar symbols. Consistent numbers let the same product sold at different terminals roll up into one line, while local codes split it into three.
Quantity and net amount give you units per transaction and average spend. Discount and tax let you separate revenue from margin and from money you're holding for the tax authority. Tender type shows how much of the day arrives by card. The refund field is a correction, not a deletion, and it only works if it points back at the original sale.
The customer key is the field most venues don't have. Most sales are paid anonymously by card or cash, so a large share of rows will never carry a name. What the table describes is what a till can record, not what a venue knows about each guest.
How a single sale becomes data
A sale looks instant from the guest's side and is a sequence of writes on the system's side. Following one flat white from order to report shows where the data gets made, and where it usually gets damaged.
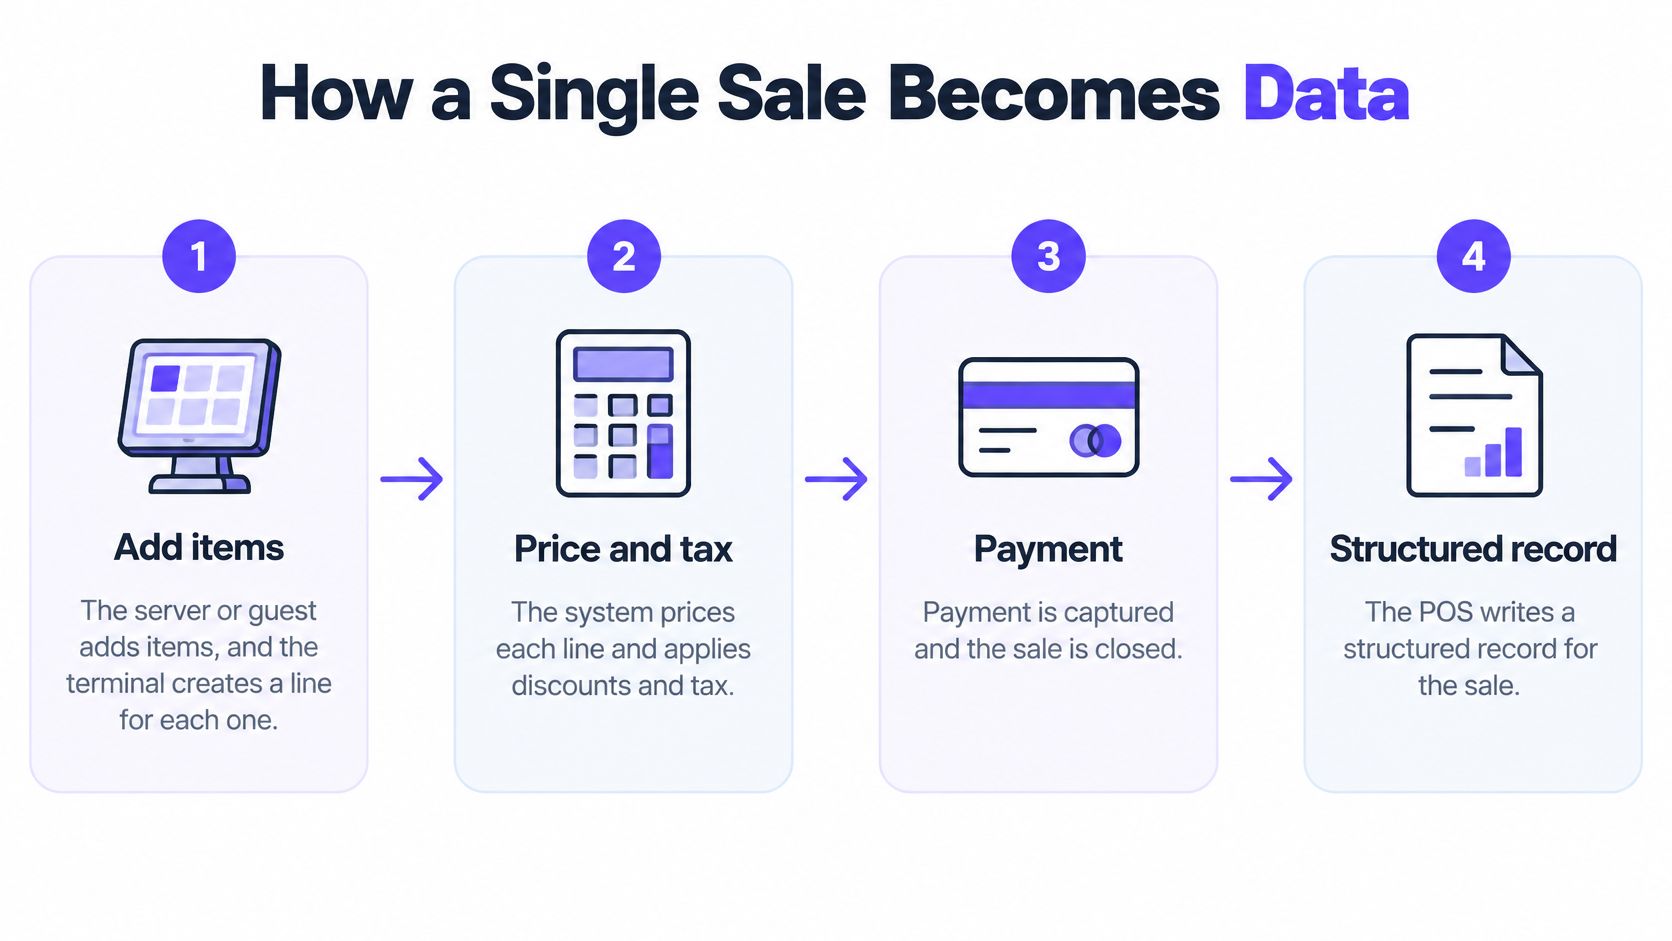
- Add the items. The barista, server or guest taps each item, and the terminal creates a line for it. Guest-facing ordering keeps shifting that work to the table, with 60% of full-service restaurant customers in 2024 saying they would likely use a tablet to place an order and 65% saying they would use one to pay the check, per the U.S. National Restaurant Association. The common slip here is a hand-entered "misc" item that can never be analysed later.
- Price and apply tax. The system pulls the current price, applies any promotion, and calculates tax. A slip that hurts for months is a promotion applied at the wrong daypart, because the discount then looks unrelated to the campaign that commissioned it.
- Authorise the payment. The terminal sends the amount to the processor and receives an approval or a decline. A declined attempt must land as a failed payment, never as a completed sale, or revenue and visit counts both inflate.
- Close and stamp the record. The sale completes, and the record takes its timestamp, venue and terminal identifiers. Records written offline during a connection drop must sync later with their original time, not the time they arrived.
- Sync to the back office. The till replicates its records to a reporting layer, on site or in the cloud. Delayed sync is the most common reason two reports disagree at 9am on a Monday.
- Aggregate into reports. Sales roll up by item, hour, day and site. A duplicate transaction ID becomes a phantom £6.50 on a dashboard nobody can explain.
- Record reversals as new events. A refund or void should be a fresh, linked record, not an edit that erases the original. That's the principle behind GS1's system architecture guidance, which keeps identification keys such as GTIN for trade items and GLN for locations so a system can tie what was sold to where it happened without destroying history.
The audit trail isn't bureaucracy. If a refund overwrites a sale, then customer lifetime value, offer redemption, and any incremental-lift calculation built on top of it become unauditable, and you can't tell a real lift from a correction.
Purchase Metrics venues Calculate from till data
Managers come back to three questions every week: what sold, when it sold, and what each visit was worth. Every metric below is one of those three questions wearing a different coat, worked through for a venue recording 310 transactions and £2,400 in net sales.
| Metric | How It Is Calculated | Decision It Informs |
|---|---|---|
| Average transaction value | Net sales divided by transactions (£2,400 ÷ 310 = £7.74) | Pricing and upsell targets |
| Units per transaction | Units sold divided by transactions (620 ÷ 310 = 2.0) | Bundling and add-on prompts |
| Product mix | Share of units or revenue per item (coffee at 34 percent of units) | Menu design and stock planning |
| Daypart sales | Sales grouped by hour or day (Sunday 12:00 to 14:00 at 31 percent of revenue) | Staffing and kitchen schedules |
| Discount uptake | Discounted transactions divided by all transactions (180 ÷ 310 = 58 percent) | Promotion reach and margin cost |
| Refund rate | Refunded value divided by gross sales (1.2 percent) | Quality and error monitoring |
| Basket pairs | Items most often bought in the same transaction (burger and fries) | Bundles and menu layout |
Average transaction value tells you whether a price change or a dessert prompt is working, and it moves faster than revenue does. Units per transaction is the metric to watch when you train staff on add-ons, because a rise from 2.0 to 2.2 shows up in the same week rather than the same quarter. Product mix decides what stays on the board and what gets a spec sheet in the kitchen.
Daypart sales settle rota arguments with evidence instead of memory. Look at where the Sunday peak sits and whether the till is staffed for the hour before it. Discount uptake is the uncomfortable one: 58 percent of transactions taking a discount means the offer is reaching most of the estate, which is a reach win and a margin question at the same time.
Refund rate is a quality signal. A single item with three times the venue's refund rate usually points at a serving temperature, a portion or a till-entry error rather than a difficult guest. Basket pairs give you the menu engineering: if burger and fries travel together, the bundle prices itself.
These are the raw ingredients for behavioural segments. RFM segmentation for restaurants and hospitality explains how recency, frequency and monetary value fall out of exactly these fields.
One contrast worth holding. Your own till data answers questions about your venue only, while syndicated POS datasets of the kind Numerator publishes pool cooperating stores across grocery, drug, mass-market, club, do-it-yourself and apparel channels to estimate category sales and market share. Useful for context, no substitute for your own 310 transactions.
A metric rising during a promotion is a signal to test, not proof of cause. Proving it takes a comparison period or a control site.
Common Misreadings and privacy limits
Four claims come up every time till data meets a marketing team, and each one leads an operator somewhere expensive.
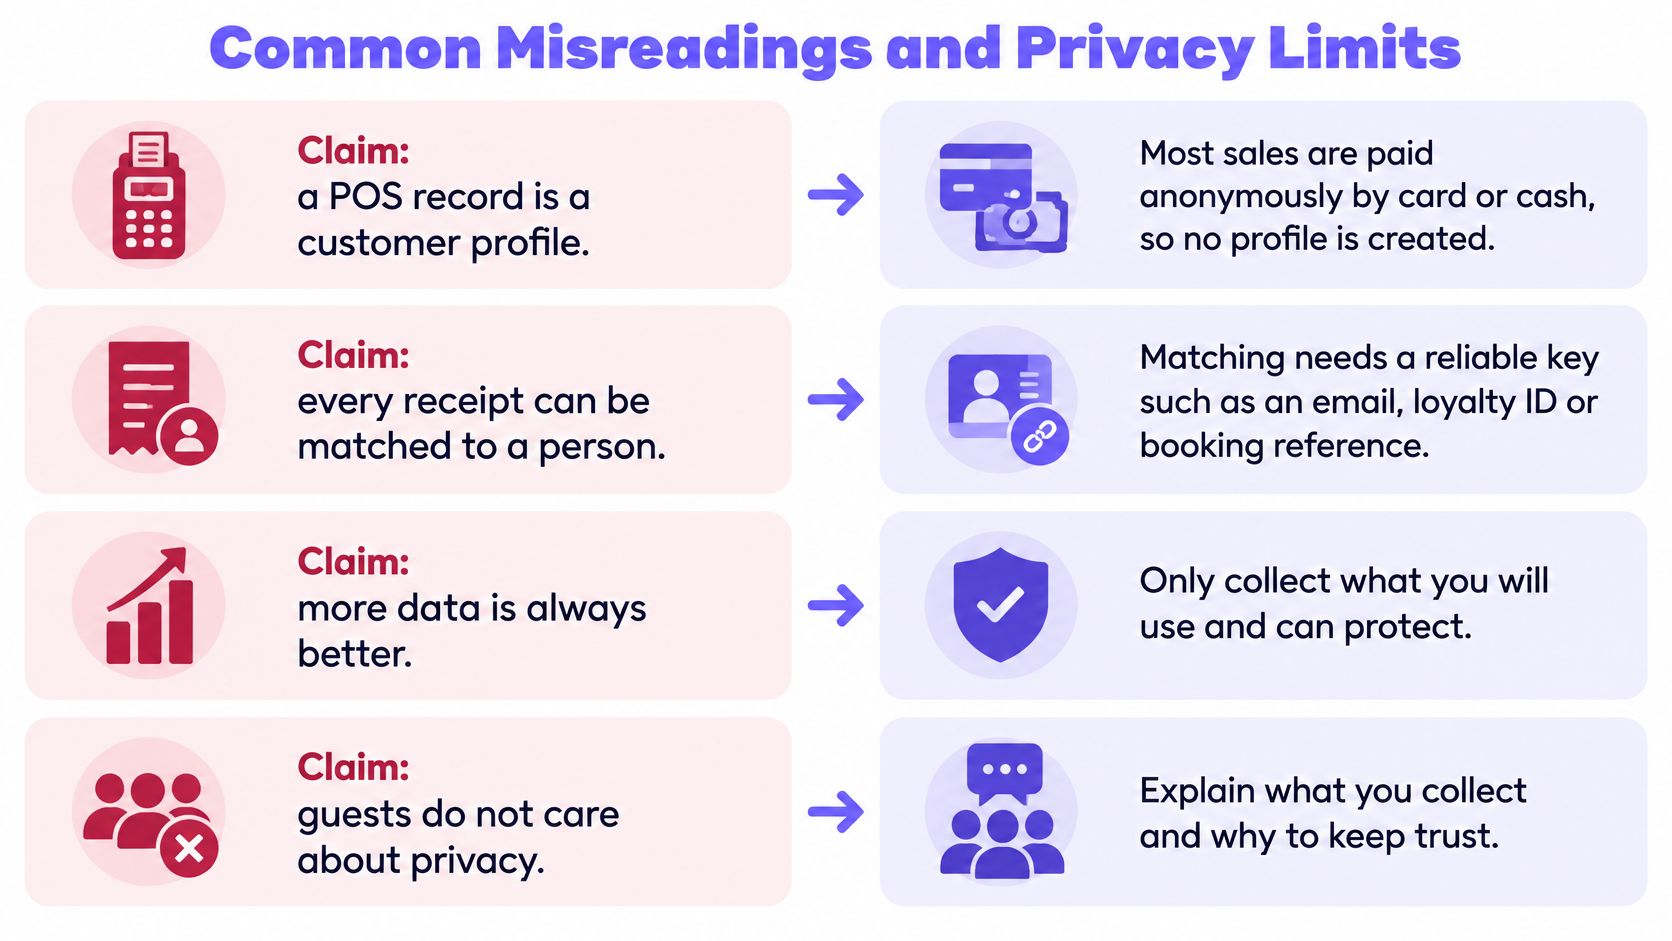
- "The POS record is a customer profile." It isn't. Most sales are paid anonymously by card or cash, so plenty of rows carry no identity at all, and a name on a bill is not the same as a consenting contact.
- "A rising monthly total means the venue is busier." A total hides the story. Three large group bills can lift a month while covers fall and the regulars you rely on drift away. Check covers and units alongside revenue.
- "Spend per guest is a clean number." Split bills, tips added afterwards and one person paying for a table all distort it. Divide by paying guest and state the rule in the report header so nobody compares two different definitions.
- "A refund is just a negative sale." Without a link to the original transaction, revenue and offer costs both overstate, and the campaign that drove the refunded purchase keeps the credit.
The privacy side is where good intentions meet real obligations. POS systems can hold card-related and personal data, so card-industry PCI DSS rules govern how that data is stored and transmitted, and full card numbers should never reach a marketing dataset. Set access controls, retention limits and consent checks before any till data touches an audience, and treat four field classes differently: operational data, pseudonymous transaction data, directly identifying data such as an email, and inferred behavioural data such as a preference score.
This is a live concern for the people signing the contracts. A 2025 survey of 200 enterprise hospitality decision-makers identified security and privacy as leading challenges, while 100% said integrated payment solutions could be valuable, as Restaurant Dive's report on hospitality payments sets out.
Tracking guest Behaviour across visits
Anonymous receipts pile up in a database and never become a guest. The step that changes that is a match key, and the whole exercise stands or falls on whether you have one you trust.
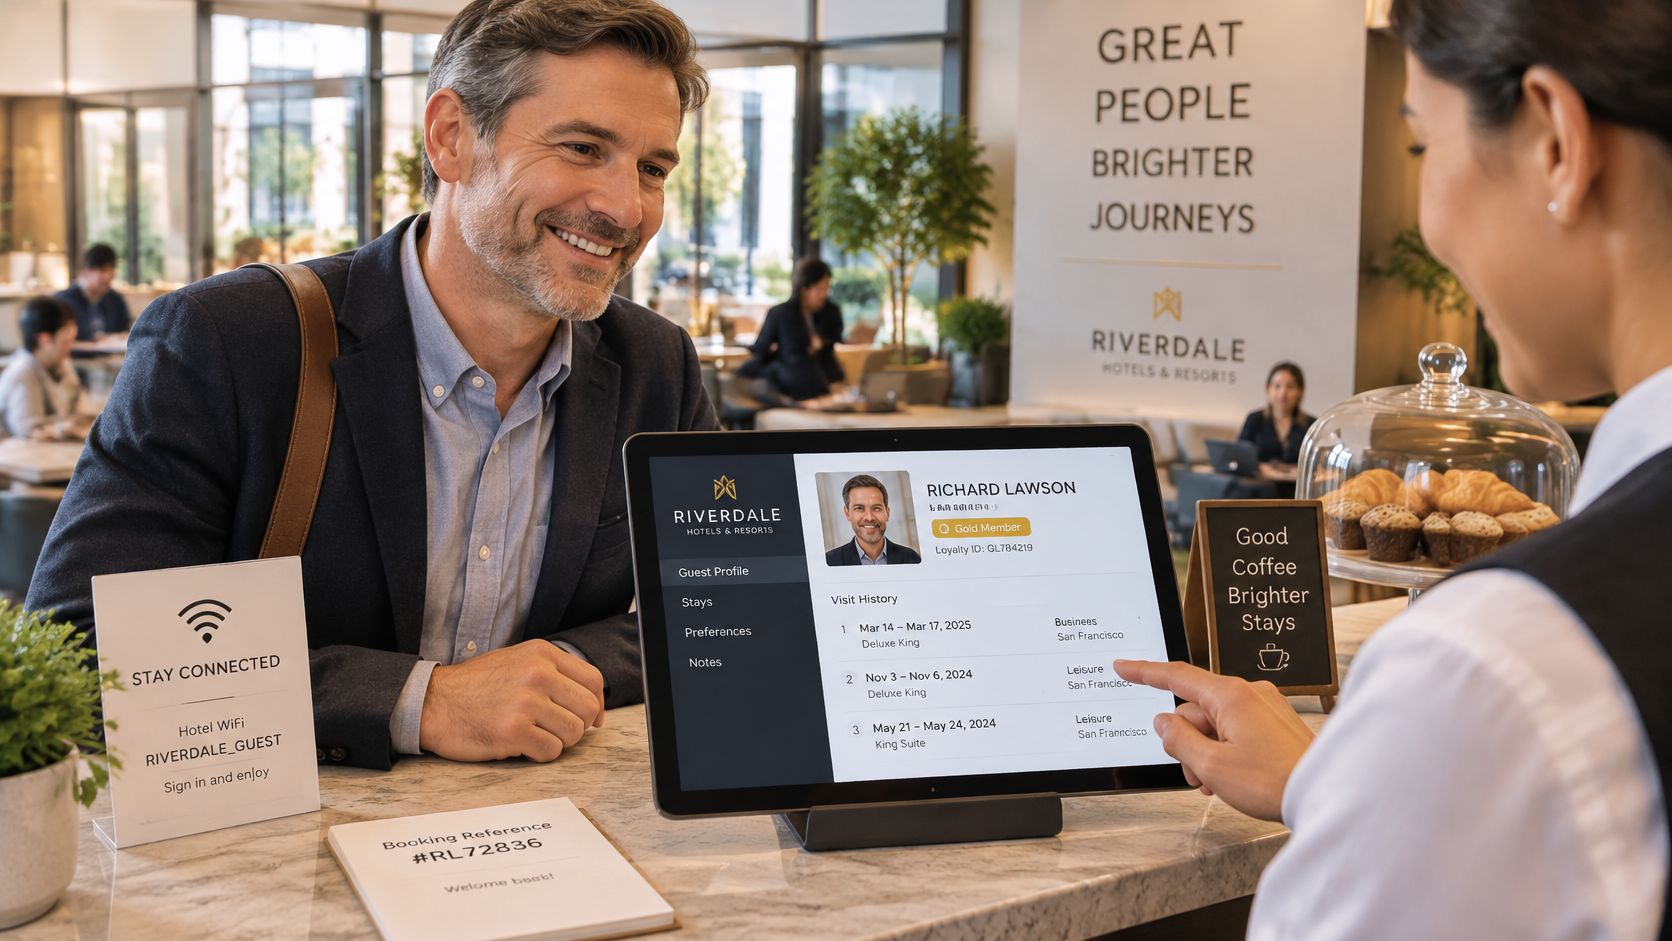
Three keys do most of the work in hospitality. An email captured at WiFi sign-in, a loyalty ID scanned at the till, and a booking or reservation reference are all reliable because the guest supplied them for their own purposes. A card number is not a key you should be using for marketing. The mechanics of joining these sources are covered in this guide to identity resolution for guest marketing, but the principle is simple: the key has to be recorded at the point of purchase and stored with its provenance.
One reliable key and three measures
With a key in place, three measures do most of the work.
Visit frequency counts distinct visits in a period, so a guest with six visits in 90 days reads as a regular by any definition a café cares about. Recency measures days since the last visit, and a guest with no visit in 45 days is a defensible lapsing flag rather than a guess. Spend bands group guests by total or average spend, which separates the high-value food buyers from the drinks-only visitors who come in for the atmosphere.
Say a café finds 1,200 guests who bought coffee at least once and never returned. That's not a mystery, it's a list, and a win-back journey aimed at it costs far less than a discount campaign aimed at everyone.
Then run the comparison that most venues skip. Take the guests who opted in through WiFi or loyalty and compare them with walk-in guests over six months on visits and spend. If capturing identity changes long-term value, that difference is the case for the whole programme, and it only shows up when you measure both groups.
Keep facts and estimates apart: what a guest bought is recorded. Which roast they prefer, or whether they'd return for a quiz night, is an inference, and inferences belong in a segment you can overrule, not in a report you'd defend to an auditor.
Measuring promotion Impact without guesswork
Proving a promotion worked is a five-step job, and skipping the second step is the usual reason a venue ends up crediting an offer for a busy week of weather.
- Pick one metric the offer should move. Lunch units per transaction is a good choice for a two-for-one food deal. One metric, decided before the offer runs.
- Set a baseline. Take the four comparable weeks before the promotion, matched by weekday, and note the seasonal weather and events. A baseline built from Tuesday lunches compared with a campaign that ran Thursday to Sunday proves nothing.
- Build a control. Use a second site without the offer, or a matched set of days at the same site. Weather, transport disruption and seasonality then hit both groups, which is what makes the comparison meaningful.
- Compare the change, not the level. If the promotion site moved from 2.0 to 2.3 units per transaction while the control site moved from 2.0 to 2.05, roughly 0.25 units can be credited to the offer.
- Check the margin. Multiply the extra units by the discounted margin and subtract the discount cost. A promotion that lifts units and loses money is a controlled experiment with a clear answer, which is still a result.
The discipline is in how you read the numbers afterwards. A single short window can be moved by one large booking, so repeat the test before you change a menu or a price. If you want the wider framework for tying spend to return, this explanation of marketing ROI in practical terms sets out how the arithmetic fits together.
Run the promotion, hold back the control, and let the difference decide. Anything else is a story about a good week.
Decide which till data to Connect First
Start with the question, not the data. Pick one thing you want answered, such as which regulars have lapsed or whether the lunch offer covered its discount, because the question tells you which fields you need and which you can ignore.
- Check item codes and venue IDs are consistent across sites. If the same flat white carries three different codes, your reports show three products and you'll spend a fortnight cleaning up a problem you created at setup.
- Confirm your match key and your consent record. Whether you chose email at WiFi sign-in or a loyalty ID, marketing consent must be recorded before a till purchase is attached to a person.
- Make sure refunds and voids are stored as linked events. Run a week of daily totals against the finance report by venue and by tender. If they don't reconcile, stop and fix the pipeline before extending it.
- Pilot on one site for four weeks. Reconcile daily, watch for duplicate transaction IDs, and keep both the ingestion date and the original transaction time on every record.
Platforms such as Purple Engage can hold WiFi sign-ins, till sales and bookings on one guest record, with a single consent ledger, and read till data without writing sales back, though the four checks apply whichever tool you choose.
Write down the one question and the one site, and start there this week. Everything else can wait until those numbers reconcile.
Purple Engage gives venue teams one guest record, one consent ledger and one measurement system across WiFi, tills, bookings and hotel stays, so the purchase history you already collect can be matched to a person only when they've opted in. Segments update themselves against visits and spend, and extra visits are measured against a held-back group rather than assumed. If you'd like to see how that works with the tills you already run, visit Purple Engage.