
Foot traffic count explained: Methods, data and uses
Learn what a foot traffic count measures, which counting methods and tools work, and how venues use the data to plan and measure marketing.
If your door count rose last quarter, does that mean demand rose? Most venue teams answer yes without pausing, and that's exactly where measurement goes wrong. A foot traffic count isn't a verdict on demand. It's an instrument reading, taken by a specific method, at a specific point, with a specific error profile, and none of that travels with the number when it lands in a monthly report.
Treat counting the way an engineer treats a gauge. What is being measured, how the meter works, how it's checked against reality, and when a rising number proves nothing at all. By the end you'll be able to write a counting specification for a venue, validate a sensor against a manual tally, and tell the difference between a campaign that created visits and one that merely coincided with them.
Table of Contents
- What a Foot Traffic Count Actually Measures
- Counting Methods From Manual Tallies to Sensors
- How to Run a Count That Holds Up
- Checking Automated Counts Against Manual Tallies
- Separating Real Demand From Campaign Lift
- Set Up Your Counting Plan Before You Spend
What a foot traffic count Actually measures
Two venues both report the same headline number for last month. One counted every crossing of its door line in both directions, including staff coming back from breaks. The other counted distinct people whose phones joined the guest WiFi. The two figures describe different things, and nothing in a weekly report tells you that.
The Federal Highway Administration's review of pedestrian monitoring shows how many instruments sit under the phrase: manual field counts, manual video review, automated video, passive and active infrared sensors, radio beams, thermal cameras, laser scanners, pressure or acoustic pads. Each produces a number. Only some produce the number you think you're reading.
A foot traffic count is a count of movements at a defined point during a defined period. Standard outputs are pedestrian movements, crossings, or average volume. The same guidance describes how short counts become estimates: the Bureau of Transportation Statistics sets count intervals of 5, 10, 15 or 30 minutes, taken inside the relevant time periods, then expanded to estimate hourly or average daily volumes.
That expansion step is where comparisons break. A 15-minute sample at 6pm on a Friday, multiplied out, isn't the same measure as a 15-minute sample at 10am on a Tuesday, multiplied out, even when both end up labelled "daily footfall."
| Measure | What It Counts | Typical Unit |
|---|---|---|
| Pedestrian movements | Every pedestrian passing a point | Pedestrians per count interval |
| Crossings | Passes over a defined line or crosswalk | Crossings per hour |
| Average volume | Expanded short counts across a period | Pedestrians per day, week or year |
| Unique visitors | Distinct people, only if identified | Unique people per week |
| Repeat visits | The same person returning | Visits per person per 30 days |
| Dwell time | Minutes spent inside or in the zone | Minutes per visit |
| Purchases | Transactions linked to visits | Sales per visit |
Read the rows against real premises. In front of a shop, crossings per hour by direction answers an exposure question: how many people had a chance to see the window. At a bar door, entries per hour matters more, and it diverges sharply from crossings on a corner site where people walk past twice. At a cinema, the figure that predicts staffing is people arriving in the 30 minutes before a screening, not a monthly total.
Then there are the limits. Point counts don't capture how long people walk or how far they travel, and the FHWA notes they're hard to generalise across a whole city. A doorway figure that's accurate for your entrance says little about the street outside it, let alone the district.
The decision rule: name the measure your decision depends on before you buy a sensor. If the decision is "do we need a second host on Saturdays," the measure is entries per hour by half hour. If it's "did the campaign work," the measure is returning guests against a held-back group.
Identity and dwell are separate measurements from movement, and the guide to dwell time and visit data segmentation sets out how to keep them apart when you report.
Counting Methods from manual tallies to sensors
Every automated system traces back to a person with a clicker or a count board, recording pedestrians on a data sheet. That baseline is cheap, transparent and auditable, and it's the only method where a human applies a rule in real time, such as counting entries but ignoring anyone who turns back at the door. It's also tiring, which is why a full-day manual count is usually a bad idea.
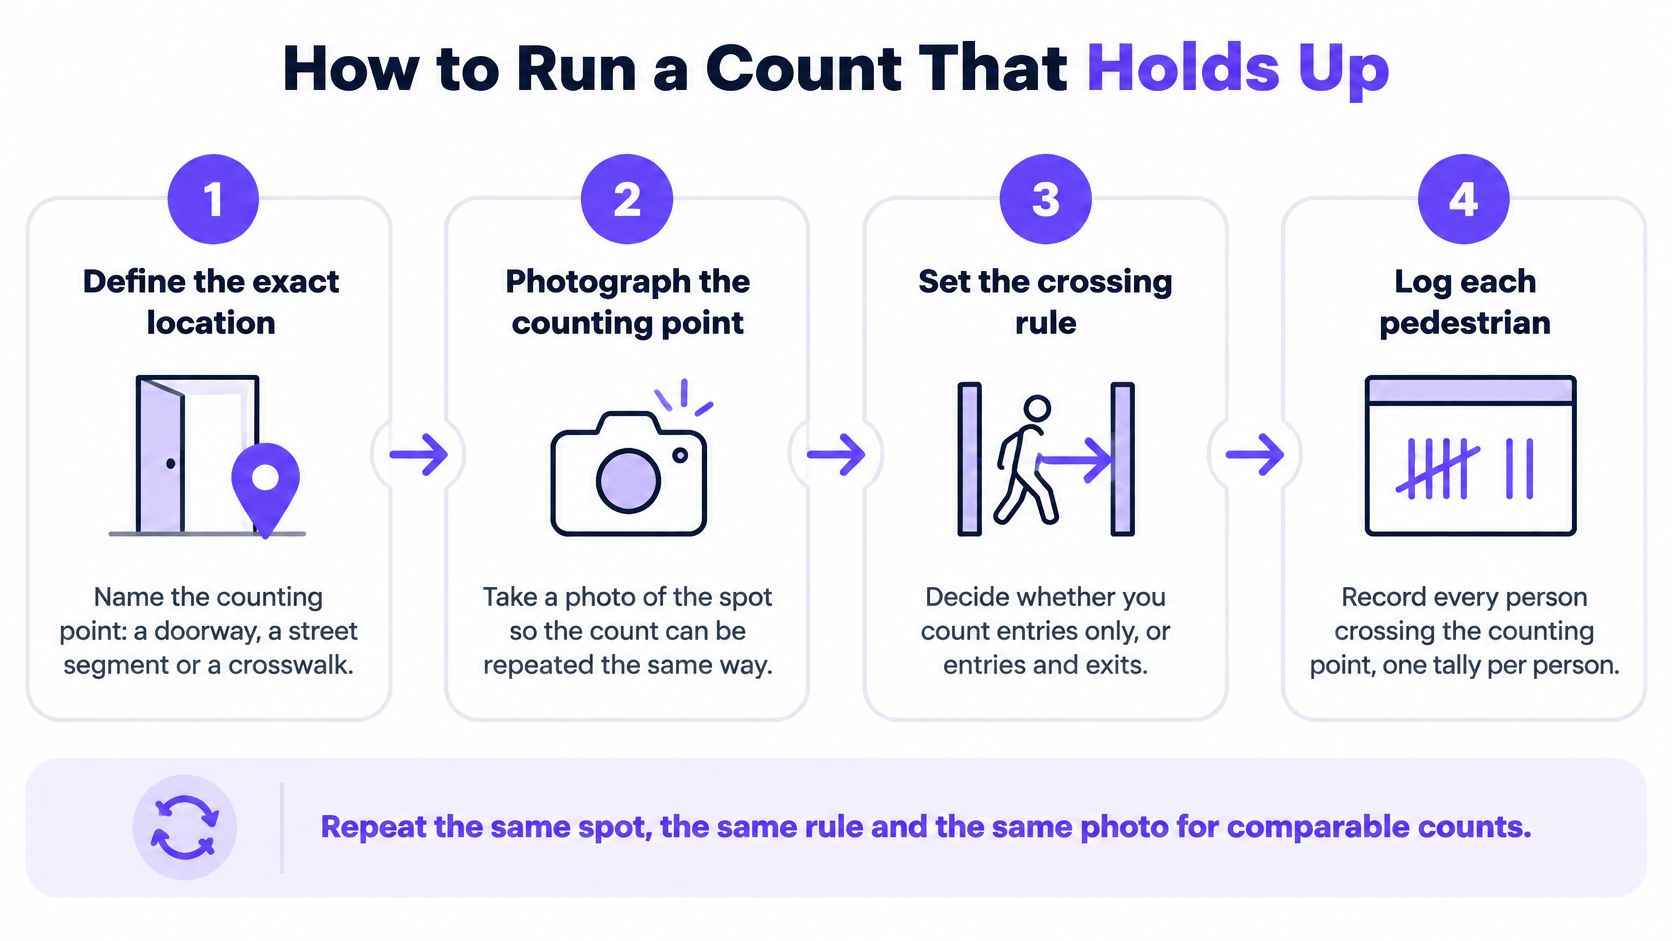
The four steps below fix the counting point before any technology touches it, whether you're holding the clicker yourself or commissioning an install.
Video, whether a person watches or software does
Manual video review means staff count people in recorded footage. It's slow, which is why nobody runs it continuously, but it rewinds, and that makes it the reference standard for checking an automated counter after installation. Automated video analytics hands the same job to software that detects and tracks people, giving continuous hourly counts, and it fails in predictable ways: crowds where people overlap, and lighting that changes the contrast the model depends on.
| Method | How It Counts | Best Suited To | Main Limit |
|---|---|---|---|
| Manual tally with clicker or count board | Observer logs each pedestrian on a data sheet | Short spot counts and audits | Labour-intensive and prone to observer fatigue |
| Manual video review | Staff count people in recorded footage | Checking automated output | Slow to process |
| Automated video analytics | Software detects and tracks people | Continuous hourly counts | Occlusion and lighting errors |
| Passive infrared sensor | Detects body heat as people pass | Doorways and aisles | Crowds passing together can be undercounted |
| Active infrared beam | Beam is broken as a person crosses | Single entrances | A group crossing together may register once |
| Radio beam | Signal interrupted by a passer | Narrow entrances | Placement sensitive |
| Thermal camera | Detects heat signature in view | Privacy-sensitive counting | Cost and mounting |
| Laser scanner | Detects passers across a line | Fixed-lane corridors | Needs a clear line of sight |
| Pressure or acoustic pad | Registers a step or sound | Ground-level lanes | Installation in the walking path |
| WiFi connection count | Devices joining a venue network | Venues with guest WiFi | Counts only guests who connect |
WiFi counts the guests who opted in
WiFi-based counting reports devices that join a venue network, so it captures only the guests who connect. That makes every figure from it a floor rather than a total: guests who never joined the WiFi aren't in the count at all, and the quieter your sign-in prompting, the further the number drifts below reality. Read a WiFi return visit as a lower bound and size your conclusions accordingly.
Three questions shorten the shortlist: how many hours of data do you need, what accuracy does the decision require, and what budget and privacy rules apply on site? A venue answering "40 hours a month, plus or minus 10%, and our legal team needs a say" has already ruled out two rows of the table.
Privacy duties differ by method, and they aren't interchangeable. Thermal, WiFi and video each collect something different, and an anonymous count should never be joined to an individual's purchases unless that guest has consented to the link. For camera-based counting in particular, placement and analytics settings decide how much occlusion you'll fight. This walkthrough of the counting process is worth watching before you sign an install sheet.
How to run a Count That Holds Up
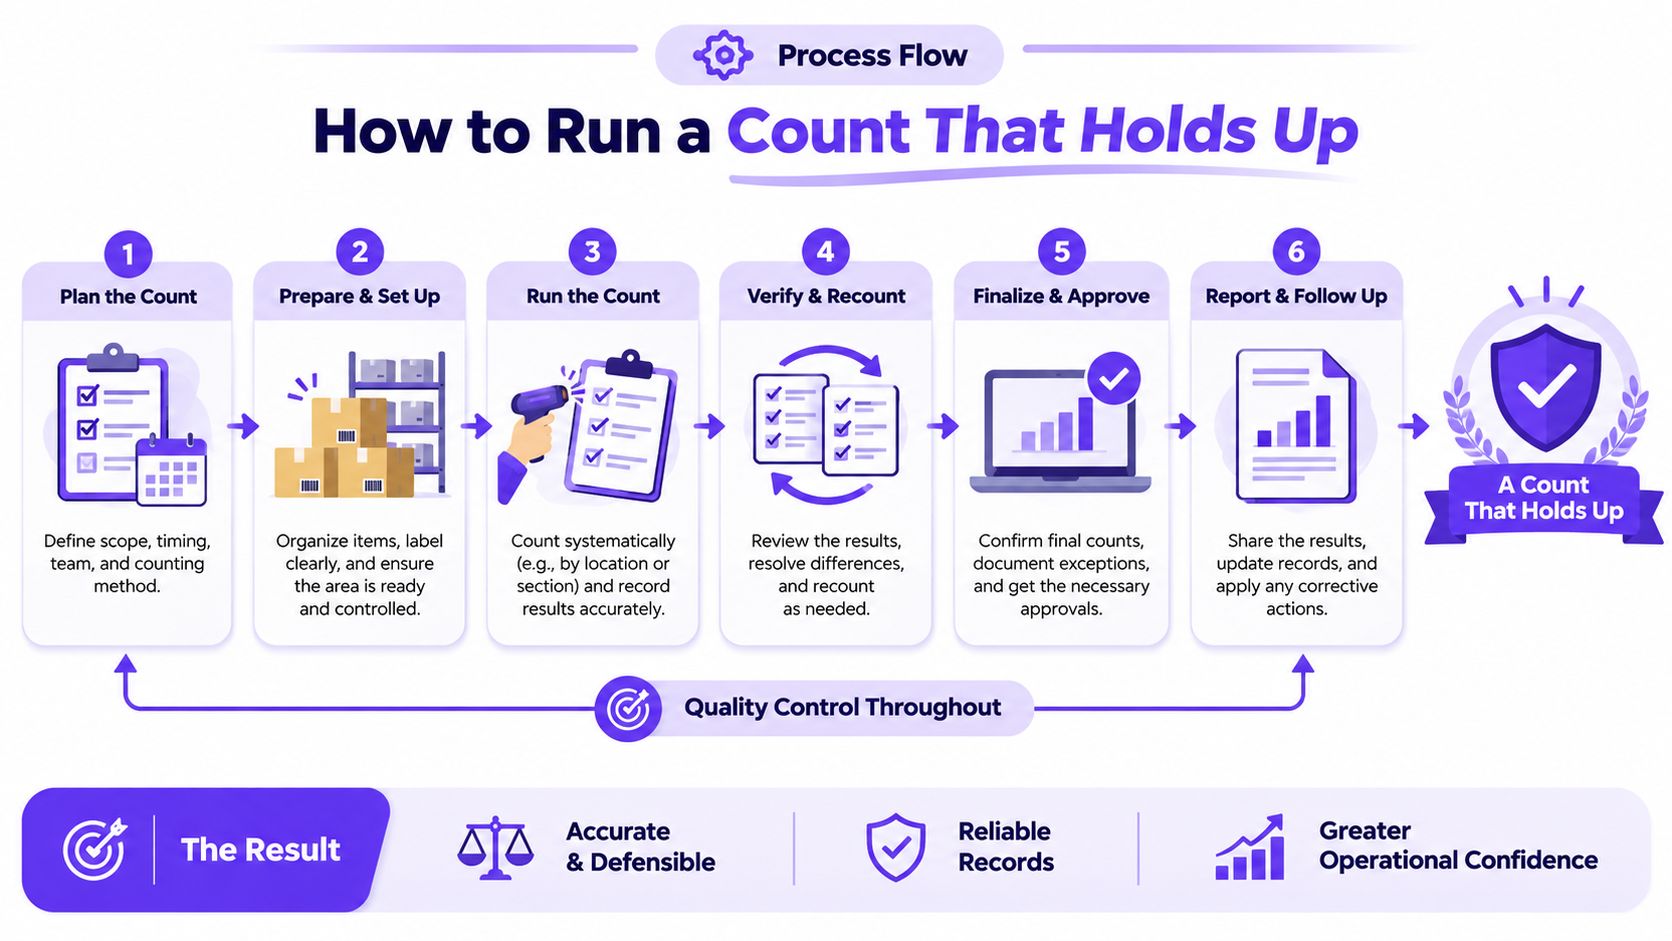
A foot traffic count is only useful if its rules stay consistent. Record where, when and how people are counted, then use the same method for future counts. Otherwise, a change in the number could reflect a change in method rather than a change in visits.
- Define the exact location. Specify the doorway, street segment or crosswalk. “Outside the venue” is too vague to reproduce or compare with an earlier count.
- Photograph the counting point. Record the camera angle and sensor position. After a refit, the photo helps establish whether the count is still being taken from the same spot.
- Set the crossing rule. Decide whether to count entries only, movement in both directions, or passes through a defined zone. Write the rule down: counting a guest who leaves and returns differs from counting only first entries.
- Choose the time windows. Include weekday peaks, quieter periods and a weekend if those periods matter to your decision. A sample taken only during a busy period cannot represent the whole week.
- Fix the interval and sample within it. Choose 5, 10, 15 or 30 minutes, following the Bureau of Transportation Statistics intervals, and take several samples in each time window. One short session may capture an unusual queue rather than typical traffic.
- Timestamp every interval. Record the start and end time on the tally sheet or in the sensor log. Without timestamps, you cannot reliably compare counts with weather, events or promotions.
- Expand short counts into hourly and daily averages. Compare like with like: expand a weekday-morning sample within that time window, not across a Saturday evening. Otherwise, differences in the sampling period can look like changes in traffic.
- Log conditions and file a method note. Record weather, events, road works, school holidays and promotions alongside the count. These conditions can help explain why one period differs from another.
Why the method note beats your memory
Keep the method note to one page: location, crossing rule, time windows, interval, method, counter and relevant conditions. A colleague should be able to repeat the count without guessing what the original instructions meant.
Repeat the same spot, rule and photo. If the method changes, treat the new count as a different measurement, not as a direct continuation of the old one.
Expansion can create a misleading average if the samples do not represent the periods being compared. A quiet midweek sample may understate weekend traffic; a Saturday peak may overstate the rest of the week. Sample each relevant window, then expand only within that window.
Checking automated counts against manual tallies
An automated counter reports visits, not people, and not demand. Someone who steps out for a call and walks back in can register as two visits. Demand is whether those visits become a booking or a sale, which the counter never sees. The device works like a kitchen scale: you need a definition of one unit, an error band you can quote, and a routine that checks it still reads true.
The Federal Highway Administration's guidance on automated counting reports that studies of automated video counting found pedestrian count errors ranging from roughly 5% to 13%, with occlusion as the major failure mode. Occlusion is a crowded doorway problem. When two people overlap or cross the detection path together, the system may record only the person nearest the sensor. The second person was there. The log says they were not.
Five to thirteen percent looks small until the count becomes a denominator. A campaign that lifts visits by 6% sits inside a 13% error band, so the sensor, not the campaign, decides whether you call the week a win. Visit growth inside that band does not prove demand moved, and it does not prove the campaign caused the extra trips.
The ratio test you can run in an afternoon
Pick representative low, medium and high volume periods. Run a trained manual count over the same interval, preferably from video so both sides cover the same minutes. Divide the automated total by the observed total. That quotient is the error ratio. Repeat the check when crowding, lighting, weather or camera placement changes. A ratio of 1.00 would mean the machine matched the tally. Anything else is a correction factor, or a sign the scene broke the rule you defined.
| Period Type | Manual Count | Automated Count | Error Ratio |
|---|---|---|---|
| Low volume | 180 | 191 | 1.06 |
| Medium volume | 640 | 701 | 1.10 |
| High volume or crowded | 1,250 | 1,038 | 0.83 |
| After a lighting, weather or camera change | 520 | 640 | 1.23 |
The example log tells a story. The first two rows sit inside the published range and can be corrected with a stable adjustment factor. The crowded row undercounts by roughly a sixth because people merged at the door. The last row jumps the other way, which usually means the scene changed rather than the crowd did. A ratio that drifts is a prompt to investigate, not a number to average away.
If the counter is a camera, the configuration decides most of this. The video analytics guide from ABCO Security explains what those detection and placement settings do, which is worth reading before a vendor fixes anything to a wall.
A manual video count on day one, recurring validation after that, and a written adjustment factor per period type will carry you further than a more expensive sensor with no check routine. Write each factor beside the period it belongs to. Applying a quiet-morning factor to a Saturday crush invents visits that never happened, and those invented visits look like campaign lift.
Separating real demand from campaign lift
A higher foot traffic count does not automatically mean demand has grown. A promotion may bring people in earlier than they planned, while fewer visits can coincide with stronger spending from regular customers. The count measures visits; sales, visit frequency and campaign impact require their own measures.
Retail illustrates the difference. Colliers' July 2025 retail foot traffic analysis reports that foot traffic rose 1.8% in 2025 while sales rose 3.7%. The two measures moved at different rates. A count shows how many visits occurred, not whether those visits created additional demand or revenue.
Why an aggregate number hides the answer
Colliers' year-end foot traffic recap reports that retail foot traffic growth often fell below 1% in the second half of 2025. Its July category figures also show different patterns: furniture visits rose 2.75%, clothing rose 3.93%, electronics fell 1.23%, and home improvement fell 0.35%.
A venue-wide total can hide those differences. A discount might bring a visit forward, changing when it happens without creating a new customer. A count alone cannot tell you whether a visit was incremental, whether the guest bought anything, or whether the same person would have come anyway.
The question to ask of any rise: did the campaign create an additional visit, or did it change the timing of a visit that would have happened regardless?
Benchmarks set scale, not success
Published city counts can help show how measurements differ by location and method. The MIT News coverage of a New York foot traffic model describes estimates based on observations from sidewalk segments.
| Place and Period | Measure | Reported Figure |
|---|---|---|
| NYC Midtown Manhattan, evening peak | Average pedestrians per sidewalk segment per hour | About 1,697 |
| NYC Financial District, evening peak | Average pedestrians per sidewalk segment per hour | 740 |
| NYC Greenwich Village, evening peak | Average pedestrians per sidewalk segment per hour | 656 |
The reported New York observations covered as many as 1,000 sidewalk segments on weekdays and roughly 450 on weekends in 2018 and 2019. Those figures describe sampled sidewalk segments, not a census of every pedestrian. Use a benchmark to ask whether your own number is plausible, not to claim that a promotion succeeded.
A campaign test that survives scrutiny
A credible lift estimate needs a comparison. Start by defining the audience, the outcome and the period, then compare people who received the campaign with a comparable group who did not.
Segment before you compare. Separate guests by recency, frequency, spend or response to promotions. A lapsed guest returning and a regular guest returning are different outcomes; combining them can conceal what changed.
Hold back a control group. Purple Engage reports a campaign result only after at least 50 guests have been held back. Below that minimum, the result card says “not measured yet.” For restaurants, Purple Engage recommends starting with a 14-day attribution window and adjusting it to the venue's natural visit frequency.
Calculate rates for both groups. Return Visit Rate is the percentage of email recipients who physically return within the attribution window: (return visits / emails sent) × 100. Apply the same definition and window to the campaign group and the holdout, so the comparison is like for like.
Put visits beside spend. A campaign can increase visits without increasing the value of those visits. Compare the visit result with spend, and avoid treating a higher count alone as proof of stronger demand.
Report the difference between groups. If 15% of targeted guests return within 14 days and 10% of held-back guests return, the difference is 5 percentage points. That comparison helps separate campaign lift from visits that might have happened anyway.
The same method applies beyond email. A quilting shop might send fabric to quilting influencers to promote a workshop weekend. A busy Saturday shows that people attended, but a comparable group that received no invitation is needed to assess whether the promotion added visits.
To judge a campaign, connect its measured visits to the business outcome that matters. A visit is one step toward a result, not the result itself. Understanding what marketing ROI measures can help keep that distinction clear.
Set up your counting plan before you spend
Choose the one measure the business will act on. Repeat visits, spend per visit or incremental visits after a campaign. Everything else in the plan follows from that choice, and a venue trying to optimise all of them at once will optimise none.
Write the counting specification as a single document: location, crossing rule, time windows, interval, method, validation routine, and the control group you'll hold back before the first campaign launches. Then take the first four moves in this order.
- Run a two-week baseline at one site. One location, one specification, before any campaign touches it. You need a clean number to compare against, and two weeks captures the weekly rhythm.
- Check the counter against manual tallies. Log the error ratio for each period type, and keep the log with the specification so a ratio that drifts is visible rather than assumed.
- Launch one campaign with a holdout group of at least 50 guests. Held-back guests must be comparable, drawn from the same segment and period, or the comparison measures the difference between two audiences rather than the campaign.
- Report uplift in return visit rate, with spend and dwell beside it. A 22% return visit rate is worth more than a 45% open rate with no measurable footfall, and the second number is the one a dashboard will show you by default.
A 40-site restaurant group running Mailchimp at a 35 percent open rate moved onto Purple Engage across their Cisco Meraki network, set up a Birthday Month offer and a Lapsed Diner campaign, and could then report exact footfall numbers attributed to each campaign. The difference wasn't better email. It was a held-out group and a validated visit count underneath it.
Before the first campaign, decide how you'll turn a counted visit into a contactable guest, since a validated count only becomes measurable when the people behind it can be reached and compared later; the retail footfall to email list guide walks through that step.
No campaign should be judged on raw footfall until the counter's error ratio is known and a holdout group exists. Everything in this guide reduces to that one rule, and to the quieter habit behind it: decide what you're measuring before you measure it.
Purple Engage connects the count to the guest. It records WiFi-verified visits, matches them against till, booking and stay records, and measures extra visits against a held-back control group, so you report what a campaign caused rather than what happened while it ran. If you want foot traffic counted with a validation routine behind it rather than a single number on a dashboard, visit Purple Engage and start with a two-week baseline at one venue.